The biggest fear of consumers related to the adoption of the euro refers to the possibility of price increases, whereby price rounding stands out as one of the possible reasons. Indeed, when converting current attractive prices into euros, the intention to keep kuna prices at attractive levels prevailed so far. If, after conversion, retailers were to increase all prices of food products in the euro to the next attractive level, this would increase food prices by 2.2%, non-alcoholic beverages by 2.6%, and alcoholic beverages by 1.8%. The contribution to the growth of total inflation due to the rounding of food and beverage prices in such a pessimistic scenario would amount to approximately 0.5 percentage points. However, due to the competition on the market, it is very unlikely that all retailers will round up all prices upwards, so a significantly smaller increase in prices can be expected due to their rounding to attractive levels in euro compared to the presented pessimistic scenario, which is also indicated by the experiences of countries that have already adopted the euro. In addition, currently elevated inflation could reduce the need for any additional price increases to reach new attractive levels, as this could very likely be achieved within the framework of regular price adjustments.
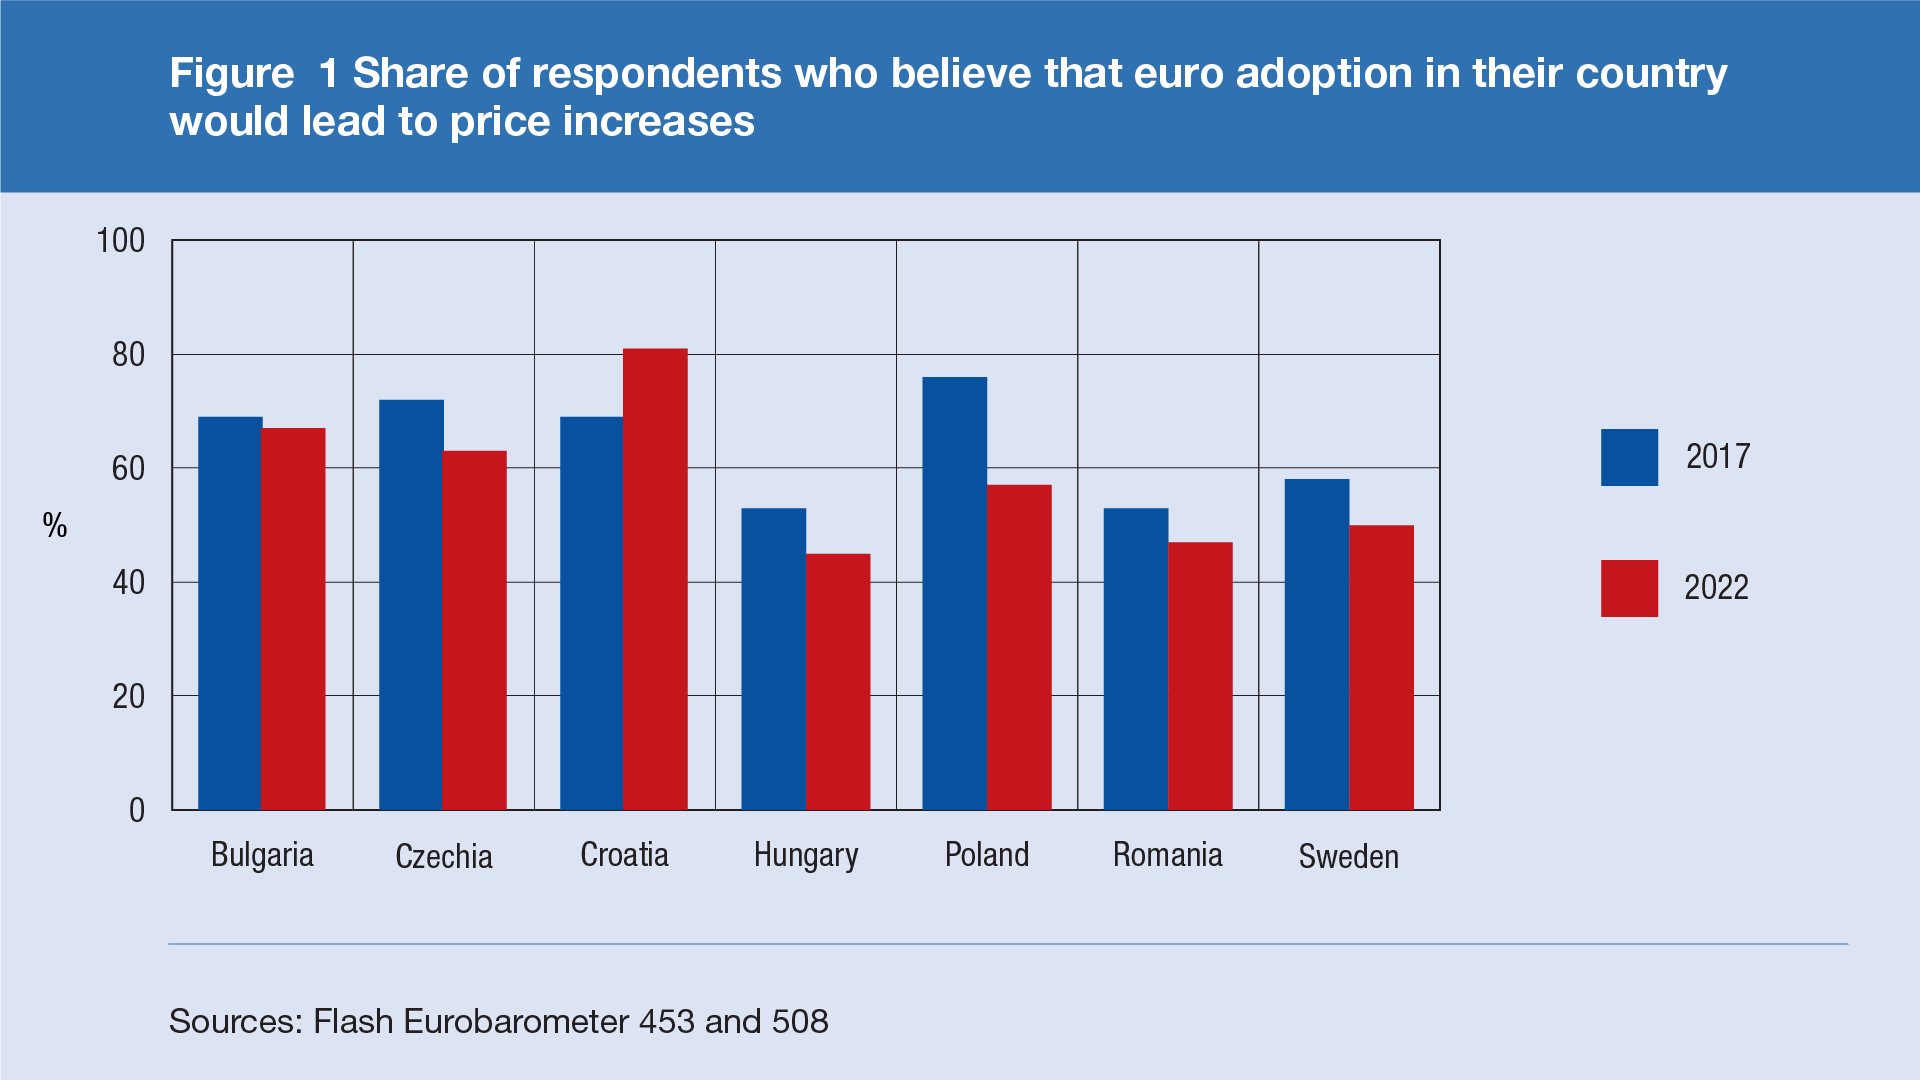
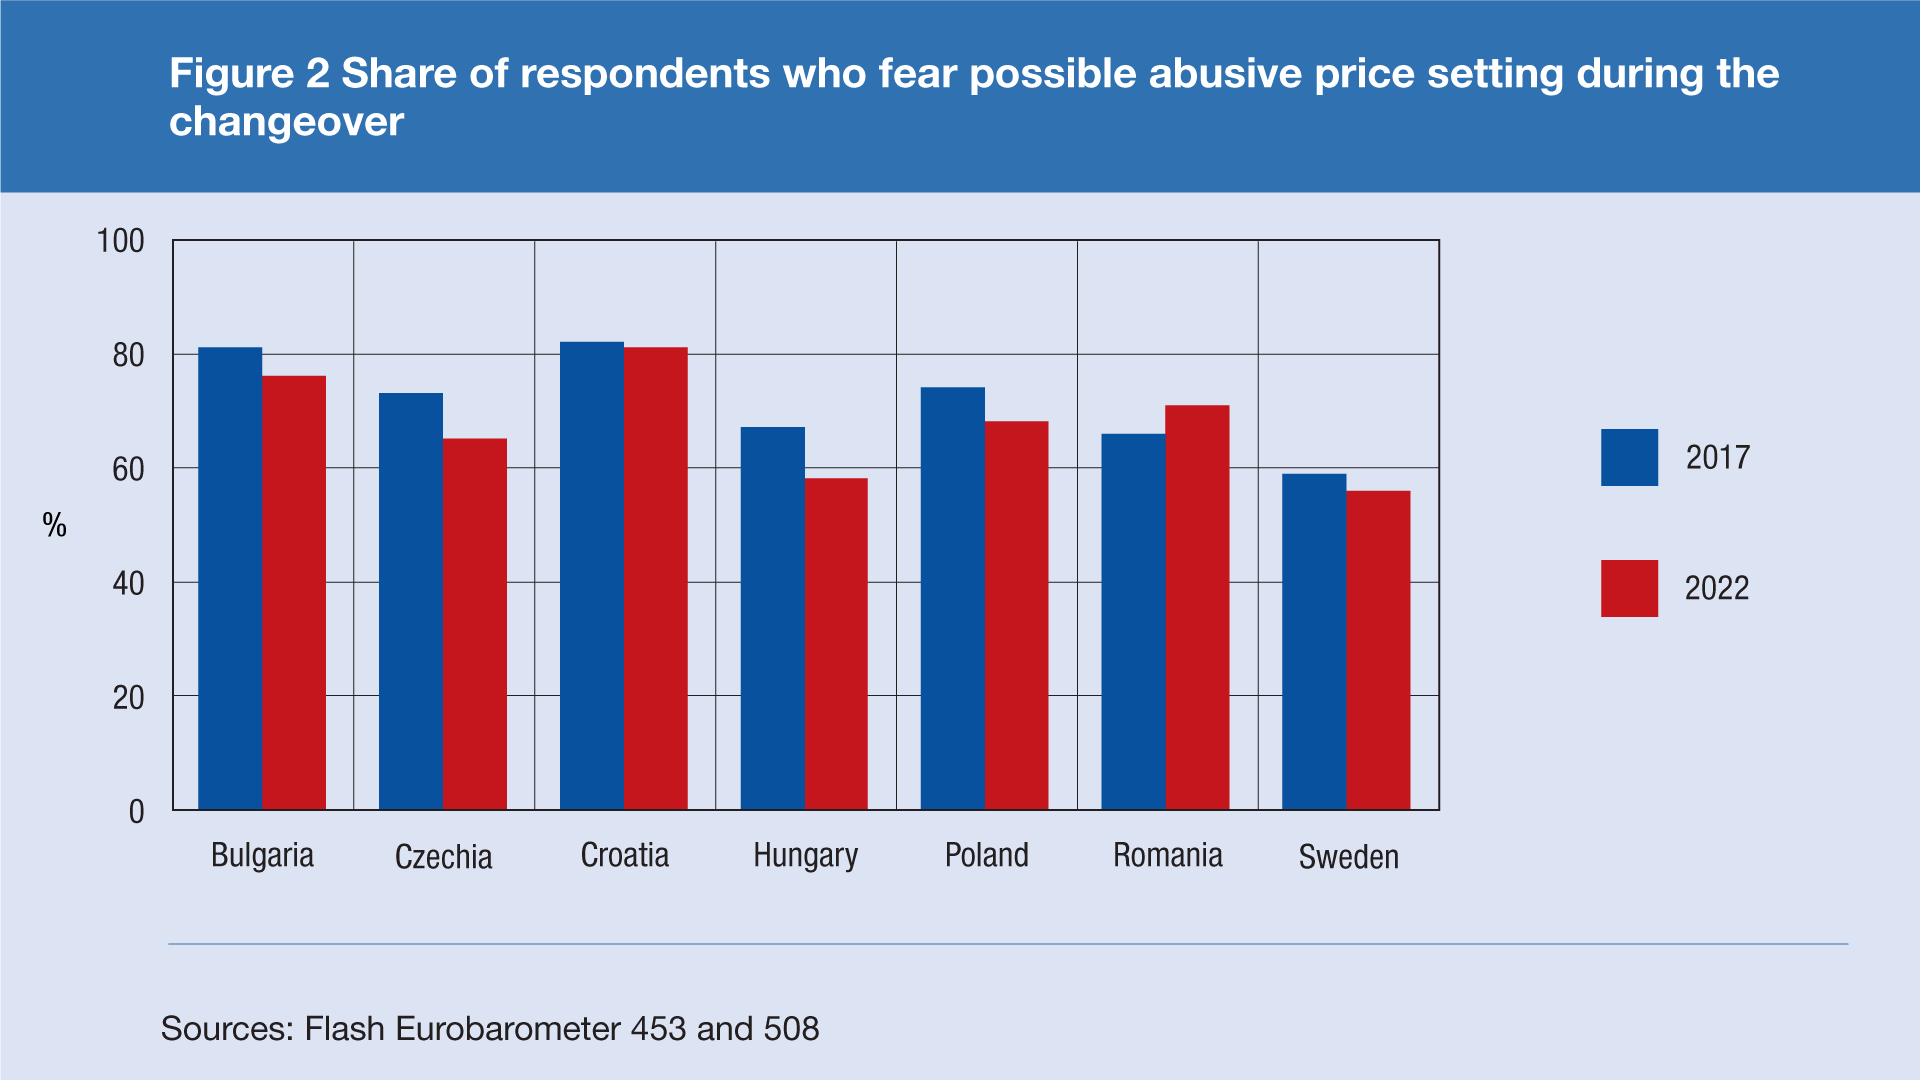
Many consumers in Croatia, as well as in other EU Member States that have committed to adopting the euro, fear price increases due to rounding or abuse when converting them into the euro (Figures 1 and 2). This fear is mostly related to the practice of setting prices in kuna at an attractive level (for example, so that they end with the digit 9 or the digits 99 after the decimal point), but those prices after conversion into the euro will no longer be at an attractive level. If domestic retailers adjust prices in euros to the next higher attractive level, this could indeed have a certain short-term impact on inflation.
In practice, we distinguish between three types of attractive prices:[1]
- psychological prices are those prices that are used believing that customers pay less attention to the digits after the decimal point, in contrast to the digits that precede the decimal point (e.g. HRK 9.90 or HRK 9.99)
- fractional prices are those prices that simplify the return of change (e.g. HRK 15.50 or HRK 6.75)
- exact prices are whole numbers and are generally used for large amounts (e.g. HRK 55 or HRK 120)
We define attractive prices in this analysis according to the rules in Table 1.
Table 1 Rules for determining attractive prices

Source: Mostacci and Sabbatini (2008)
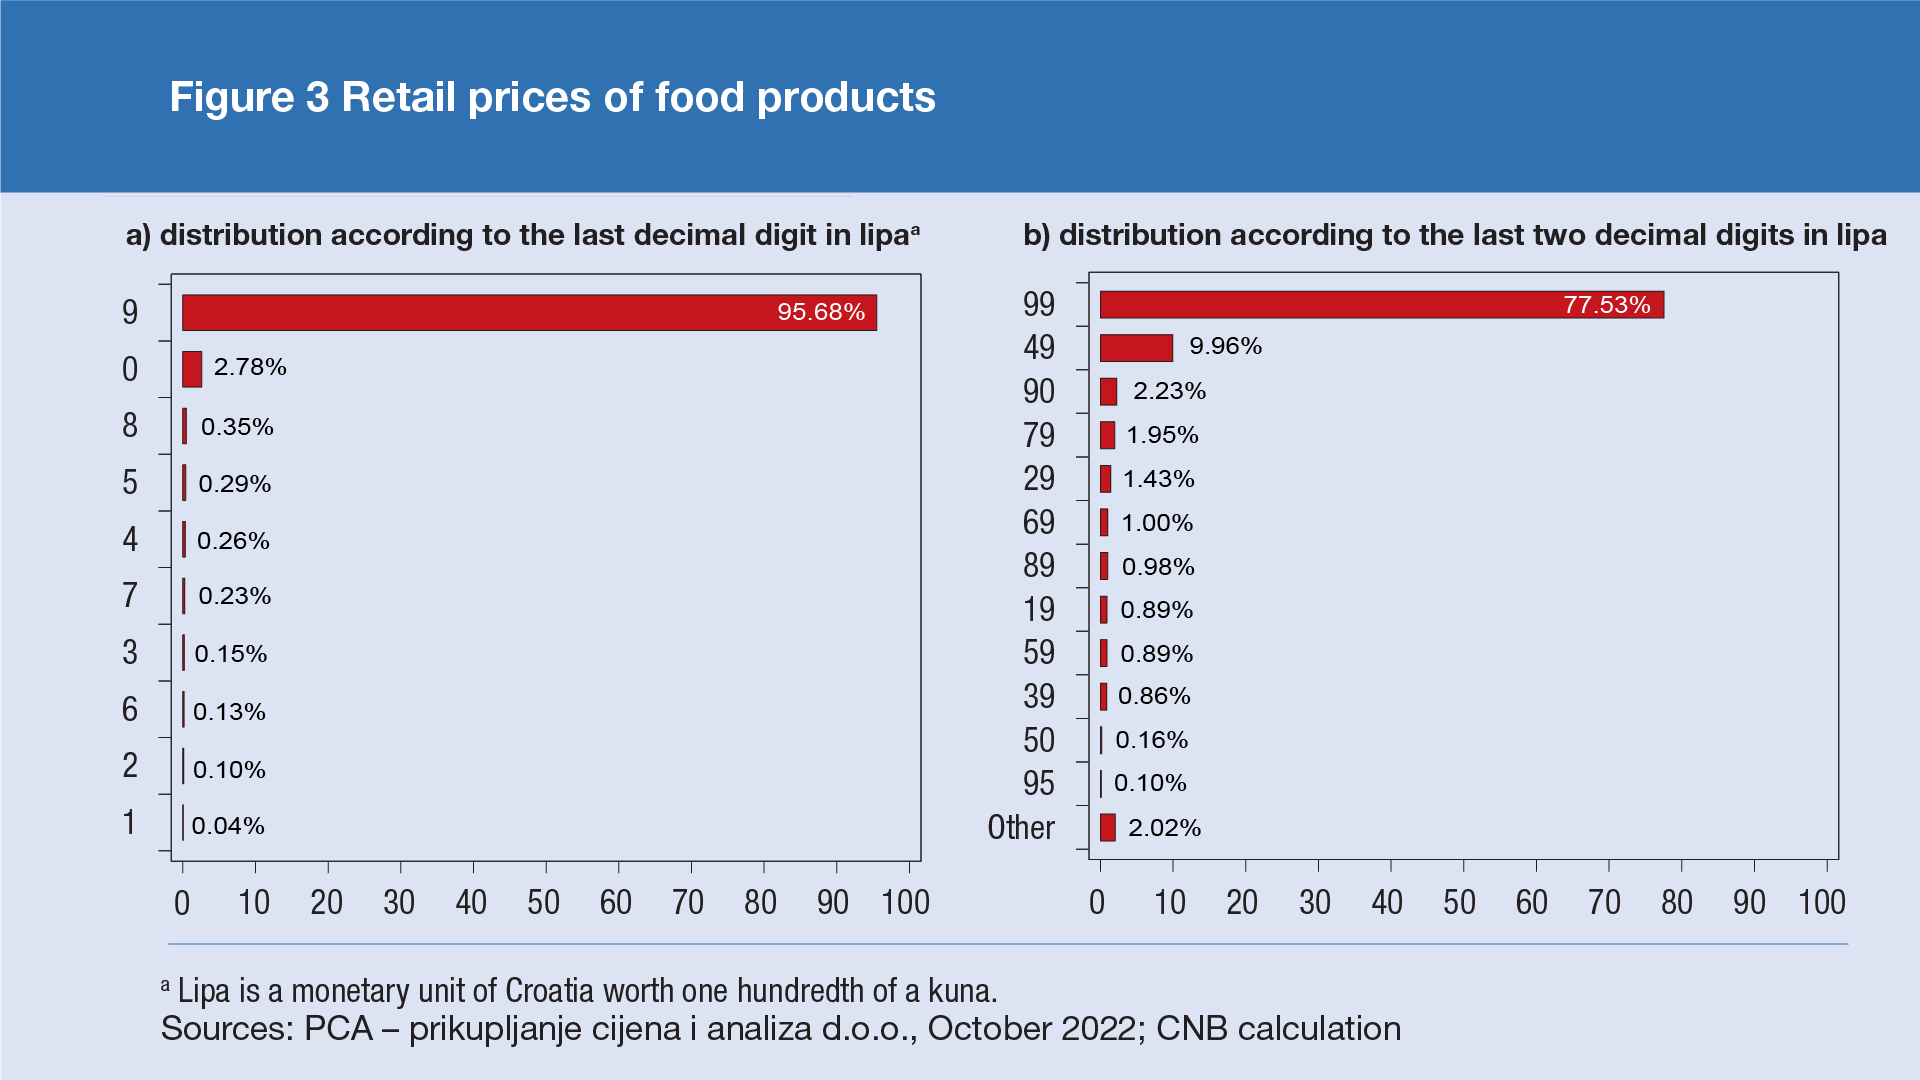
Available data confirm that rounding prices to attractive levels is indeed a prevalent practice in domestic retail chains. As many as 95.7% of the prices of analyzed food products from domestic retail chains[2] end with the digit 9, and an additional 2.8% of prices end with the digit 0, while all other final digits (except 9 and 0) account for only 1.5% of all prices (Figure 3a). If both digits after the decimal point are taken into account, it is evident that more than 77.5% of the prices of food products end with the digits 99 and another 10% with the digits 49 (Figure 3b).
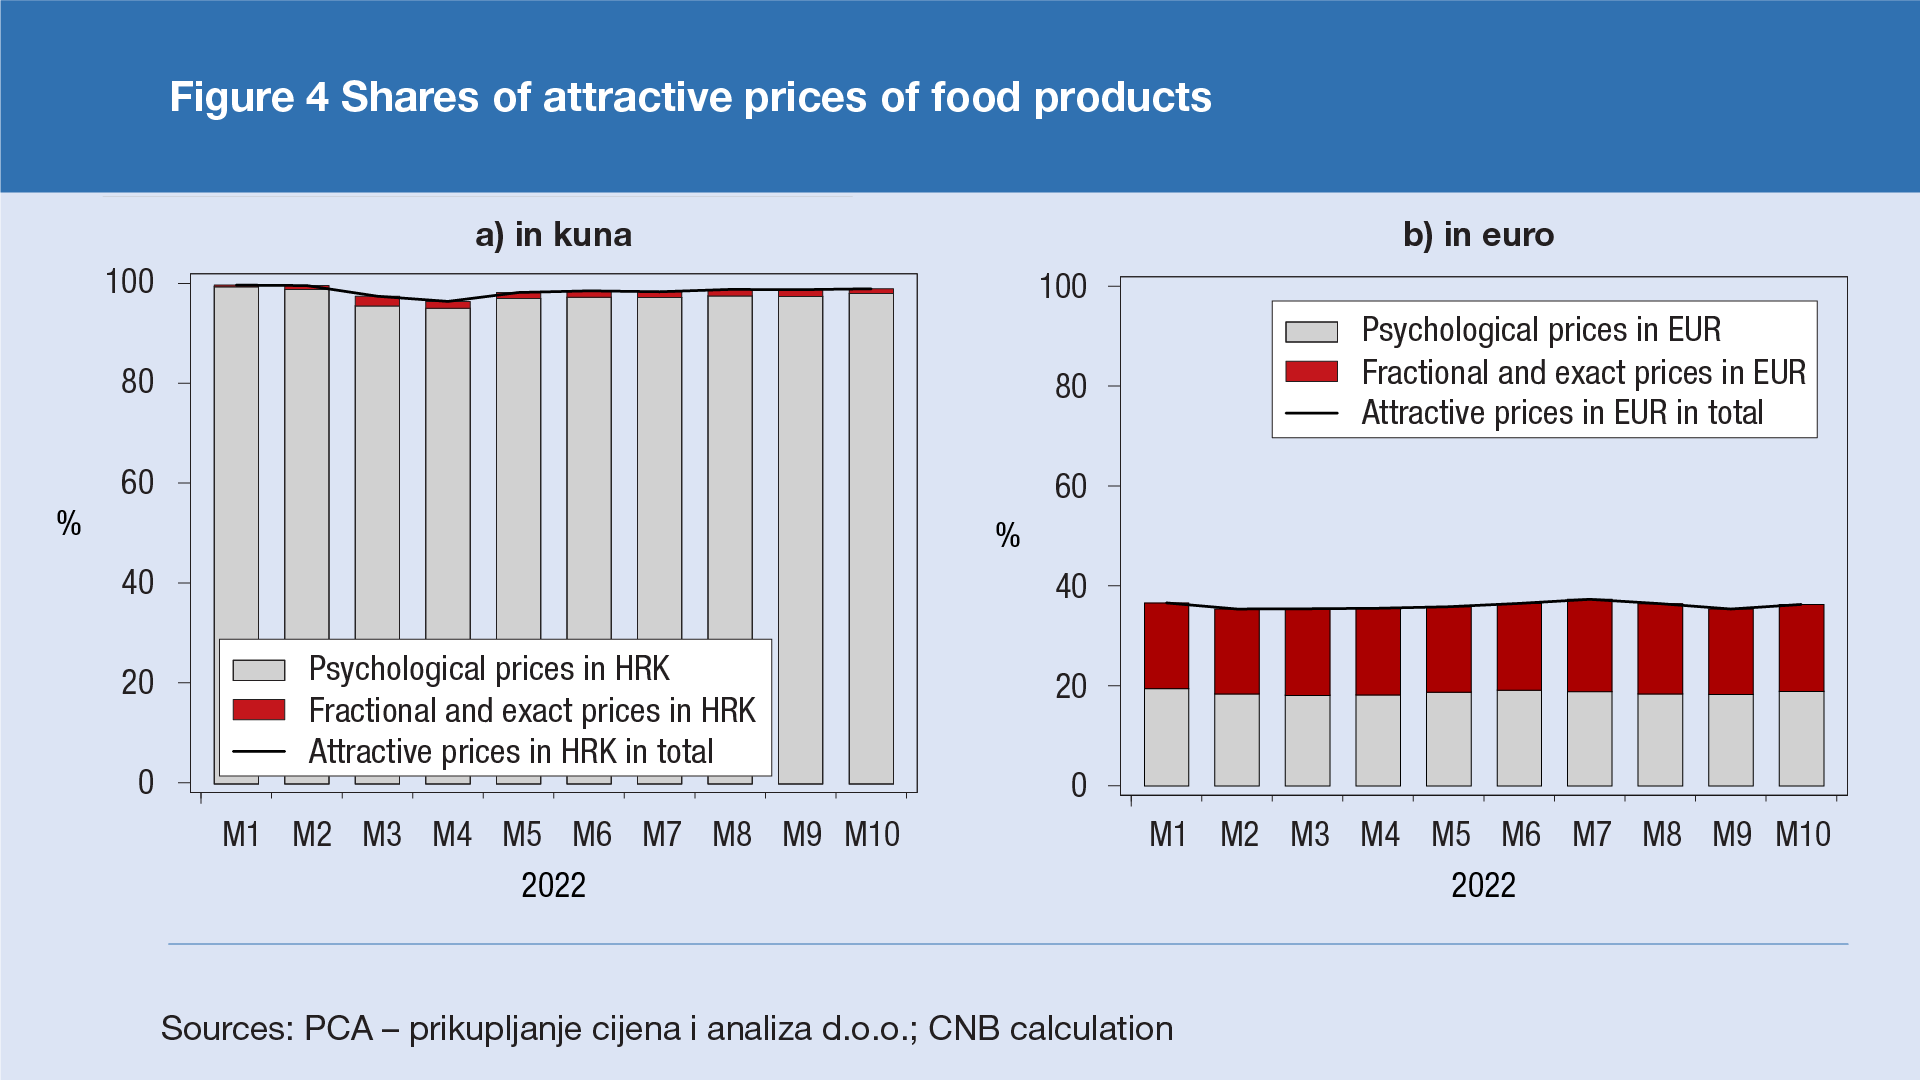
Although retailers have been displaying prices in kuna and euro since the beginning of September, the practice of attractive pricing in kuna still dominates. Figure 4 shows the shares of attractive prices of food products in kuna (Figure 4a) and euro using the official conversion rate (Figure 4b). The share of attractive prices of food products in kuna has not changed significantly since the beginning of the year, which is in line with the still relatively low share of attractive prices in euro (in October, this share amounted to around 36% compared to 98% of attractive prices in kuna).
Although the method of converting prices into the euro is clearly regulated, this does not exclude the possibility of retailers subsequently adjusting prices displayed in euro, just as they have changed kuna prices before. The Act on the Adoption of the Euro as the Official Currency in the Republic of Croatia provides for the conversion of prices from kuna to euro by applying the full amount of the fixed conversion rate and rounding the resulting amount in accordance with the mathematical rules of rounding (to two decimal places, based on the third decimal place).[4] Therefore, prices should not be rounded up to a higher figure to a greater extent than mathematical rules dictate. However, it cannot be ruled out that retailers will try to round prices to attractive levels in euros over time.[5] Therefore, as a pessimistic scenario, the rounding of all prices upwards, to the next attractive level, is simulated by applying the following rules:
- psychological prices in kuna after conversion into euro are rounded to the next higher psychological price in euro
- fractional/exact prices in kuna after conversion into the euro are rounded to the next higher fractional/exact price in euro
- prices in kuna that are not attractive remain as such in euro (they are not rounded up).
Table 2 lists several examples of price rounding according to the described rules. For example, product A costs HRK 5.99, which is considered a psychological price. After conversion into euro at the conversion rate, the price of product A in euro, rounded to two decimal places, amounts to 0.80 euro, which deviates from the psychological level. Although retailers can be expected to maintain the price of EUR 0.80 for product A, or even reduce it to EUR 0.79, which is the closest psychological level, in the pessimistic scenario it is assumed that retailers will still round up to the next higher psychological level, which is 0.89 euro. Similarly, product C costs HRK 9.50 (fractional/exact price), which is EUR 1.26 according to the conversion rate. Despite the nearest fractional/exact price being EUR 1.25, in a pessimistic scenario we assume that retailers will round the price from EUR 1.26 to EUR 1.30 (the next higher fractional/exact price).
Table 2 Examples of price rounding assuming that all prices are rounded up

The contribution of the increase in prices of food, non-alcoholic beverages and alcoholic beverages to the growth of total inflation in such a pessimistic scenario would amount to approximately 0.5 percentage points. Table 3 shows estimates of the possible effects of rounding on the growth of prices of food, non-alcoholic beverages and alcoholic beverages in the described scenario, when all retailers would round all prices upwards. The potential increase in food prices (measured by HICP) due to the rounding of prices when converting to euro is estimated at around 2.16%. For non-alcoholic beverages, the potential effect of rounding is slightly higher compared to food (amounting to approximately 2.64%), while for alcoholic beverages the effect is smaller compared to food (amounting to approximately 1.77%). However, due to competition on the market, it can be expected that retail chains will round up prices to the nearest attractive levels, which may not necessarily be higher.
Table 3 Examples of price rounding assuming that all prices are rounded up

Sources: PCA – prikupljanje cijena i analiza d.o.o.; CNB calculation
Food and beverages are components where the simulated conversion effect on prices is more pronounced than for the rest of the consumer basket due to a large share of attractive prices and a large number of relatively low prices (for which the calculated conversion effect is relatively high). With other components of the consumer price index where the share of attractive prices is lower and/or where the share of relatively higher prices is more significant, the possible effect of conversion on prices is lower. Furthermore, administratively regulated prices[6] (including energy products), which make up 22% of the consumer basket for the HICP calculation (or 25% for the CPI calculation), will be converted according to the prescribed rules, so the mentioned prices should remain unchanged after the conversion.
The experiences of countries that adopted the euro showed that the actual effect of price rounding when converting the domestic currency to the euro was significantly lower than the results of simulations in which it is assumed that all attractive prices are rounded up. Competition is an important factor that deterred retailers from raising prices, and the obligation of dual-display of prices in stores had a limiting effect on price growth. For example, in the Netherlands, it was estimated that in the aforementioned pessimistic scenario the conversion effect on the CPI and HICP could amount to approximately 0.7 and 0.9 percentage points,[7] respectively, while the analysis carried out after the conversion showed that the effect of the conversion on the CPI growth was considerably smaller (from 0.2 to 0.4 percentage points).[8]
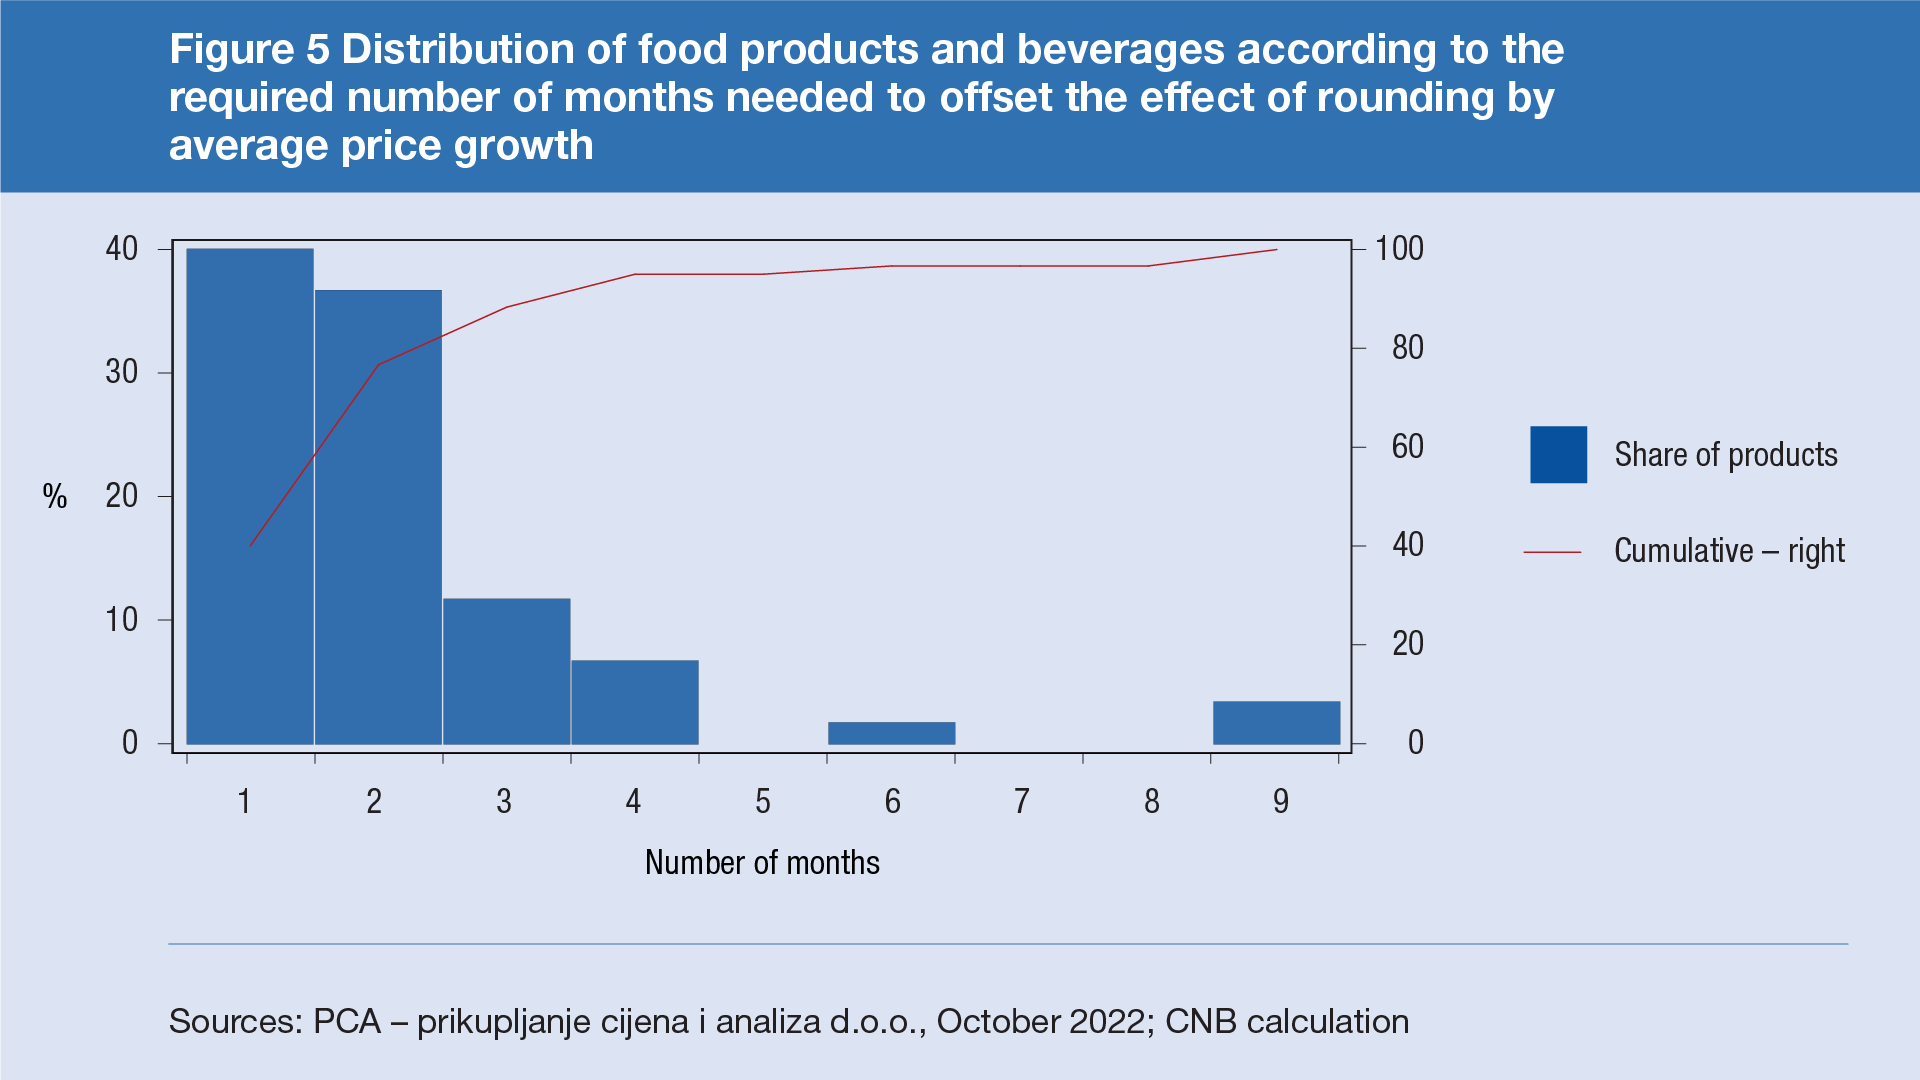
In the current environment of elevated inflation, prices could reach new attractive levels without any noticeable effect on inflation. Retailers could set prices at new attractive levels as part of regular price adjustments. Thus, the estimated effect of rounding is equal to approximately one and a half month of average increase in the prices of food products recorded in the last year, while prices of approximately 80% of these products could reach a new attractive level within two months if they continue to grow at an unchanged pace (Figure 5). The currently elevated inflation could therefore, somewhat paradoxically, reduce the need for a possible additional increase in prices in order to reach a new attractive level.
References
Aucremanne L. and Cornille, D. (2001), Attractive Prices and Euro-rounding Effects on Inflation, Working Paper, no. 17, National Bank of Belgium
Deutsche Bundesbank (2004), The Euro and Prices Two Years on, Monthly Report, January 15-28.
European Commission (2017), Flash Eurobarometer, May 453
European Commission (2022), Flash Eurobarometer June 508.
Folkertsma, C. K. (2002), The Euro and Psychological Prices: Simulations of the Worst-Case Scenario, De Economist, 150(1), 19 – 40
Folkertsma, C.K., van Renselaar, C. and Stokman, A. C. M. (2002), Smooth euro changeover, higher prices? Results of a survey among Dutch retailers, Research Memorandum No. 682.
Hillen, J. (2021), Psychological pricing in online food retail, British Food Journal, 123(11), 3522. – 3535.
Kotarac, K. and Kunovac, D. (2020), Analiza utjecaja tečaja na potrošačke cijene pri konverziji iz HRK u EUR (Analysis of the Effect of Exchange Rates on Consumer Prices in the Conversion of HRK to EUR), unpublished paper
Mostacci, F. and Sabbatini, R. (2008): Rounding and Anomalous Changes in Italian Consumer Prices in 2002, in The Euro, Inflation and Consumers' Perceptions: Lessons from Italy, Del Giovane, P. and Sabbatini, R. (eds.), Springer
Pufnik, A. (2018), Učinci uvođenja eura na kretanje potrošačkih cijena i percepcije inflacije: pregled dosadašnjih iskustava i ocjena mogućih učinaka u Hrvatskoj (Effects of the Adoption of the Euro on Consumer Prices and Inflation Perceptions: an Overview of Experiences and Assessment of the Possible Impact in Croatia), Economic Trends and Economic Policy, 27(1), 129 – 159
-
Mostacci and Sabbatini, 2008. ↑
-
In order to analyze the potential increase in the prices of food products due to the rounding of prices in the new currency, microdata on prices from retail chains in Croatia in October 2022, obtained from the company “PCA – prikupljanje cijena i analiza d.o.o. ”, which specializes in price collecting and analysis in the Croatian market, were analyzed. The sample contains a total of 7983 products, of which 6089 are food products, 1242 products are non-alcoholic beverages, and 652 products are alcoholic beverages. ↑
-
Lipa is a monetary unit of Croatia worth one hundredth of a kuna. ↑
-
The following mathematical rounding rule applies:
– if the third decimal digit is less than five, the second decimal digit remains unchanged
– if the third decimal digit is five or greater, the second decimal digit increases by one ↑
-
Germany's experience shows that in January 2002, when the euro was adopted, about two-thirds of the analyzed product prices were converted and rounded according to mathematical rules, which resulted in a decrease in the share of attractive prices, but during the following months, this share began to increase. ↑
-
For example, water supply, waste collection, postal services, rail transport, etc. ↑
-
In the simulation, the entire set of price data used in the calculation of the official consumer price index was used. ↑
-
Folkertsma (2002) and Folkertsma et al. (2002) ↑
