From August 2023 the comments on statistics, a short description of selected, recently issued statistical data in the area of monetary statistics and the non-residents sector statistics, are no longer published. They are replaced by Statistical releases.
Comments on monetary developments for July 2021
Total liquid assets (M4) rose sharply in July as a result of a large inflow of foreign exchange prompted by the tourist season. Particularly large was the increase in net foreign assets of credit institutions while on the liabilities side of monetary financial institutions, money (M1) rose the most, followed by a small increase in quasi-money.
The growth in total placements of monetary institutions to domestic sectors continued to accelerate in July, mirroring growing household lending, primarily in the form of housing loans that rose fuelled by the government subsidy programme. The placements to other financial institutions also rose, while placements to corporates fell.
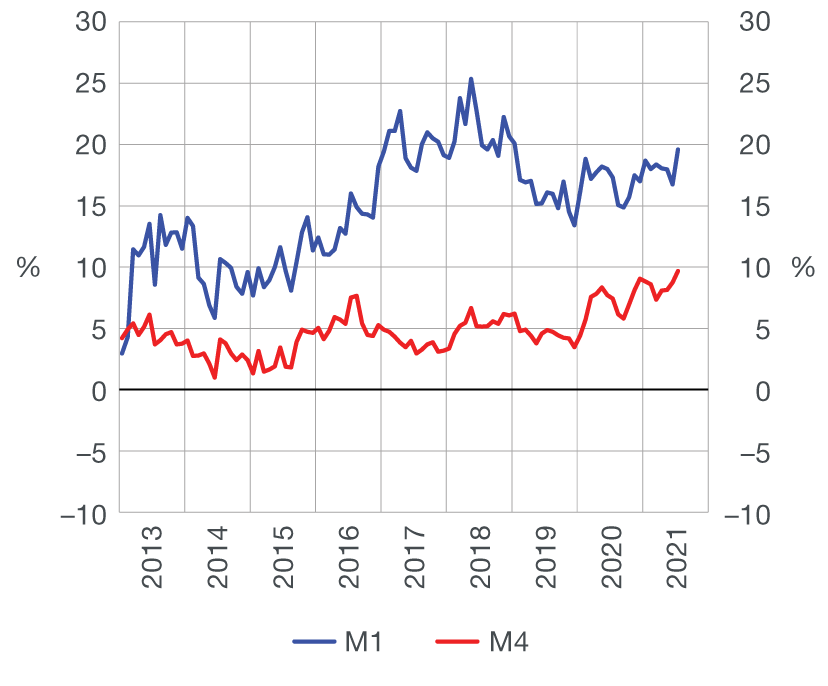
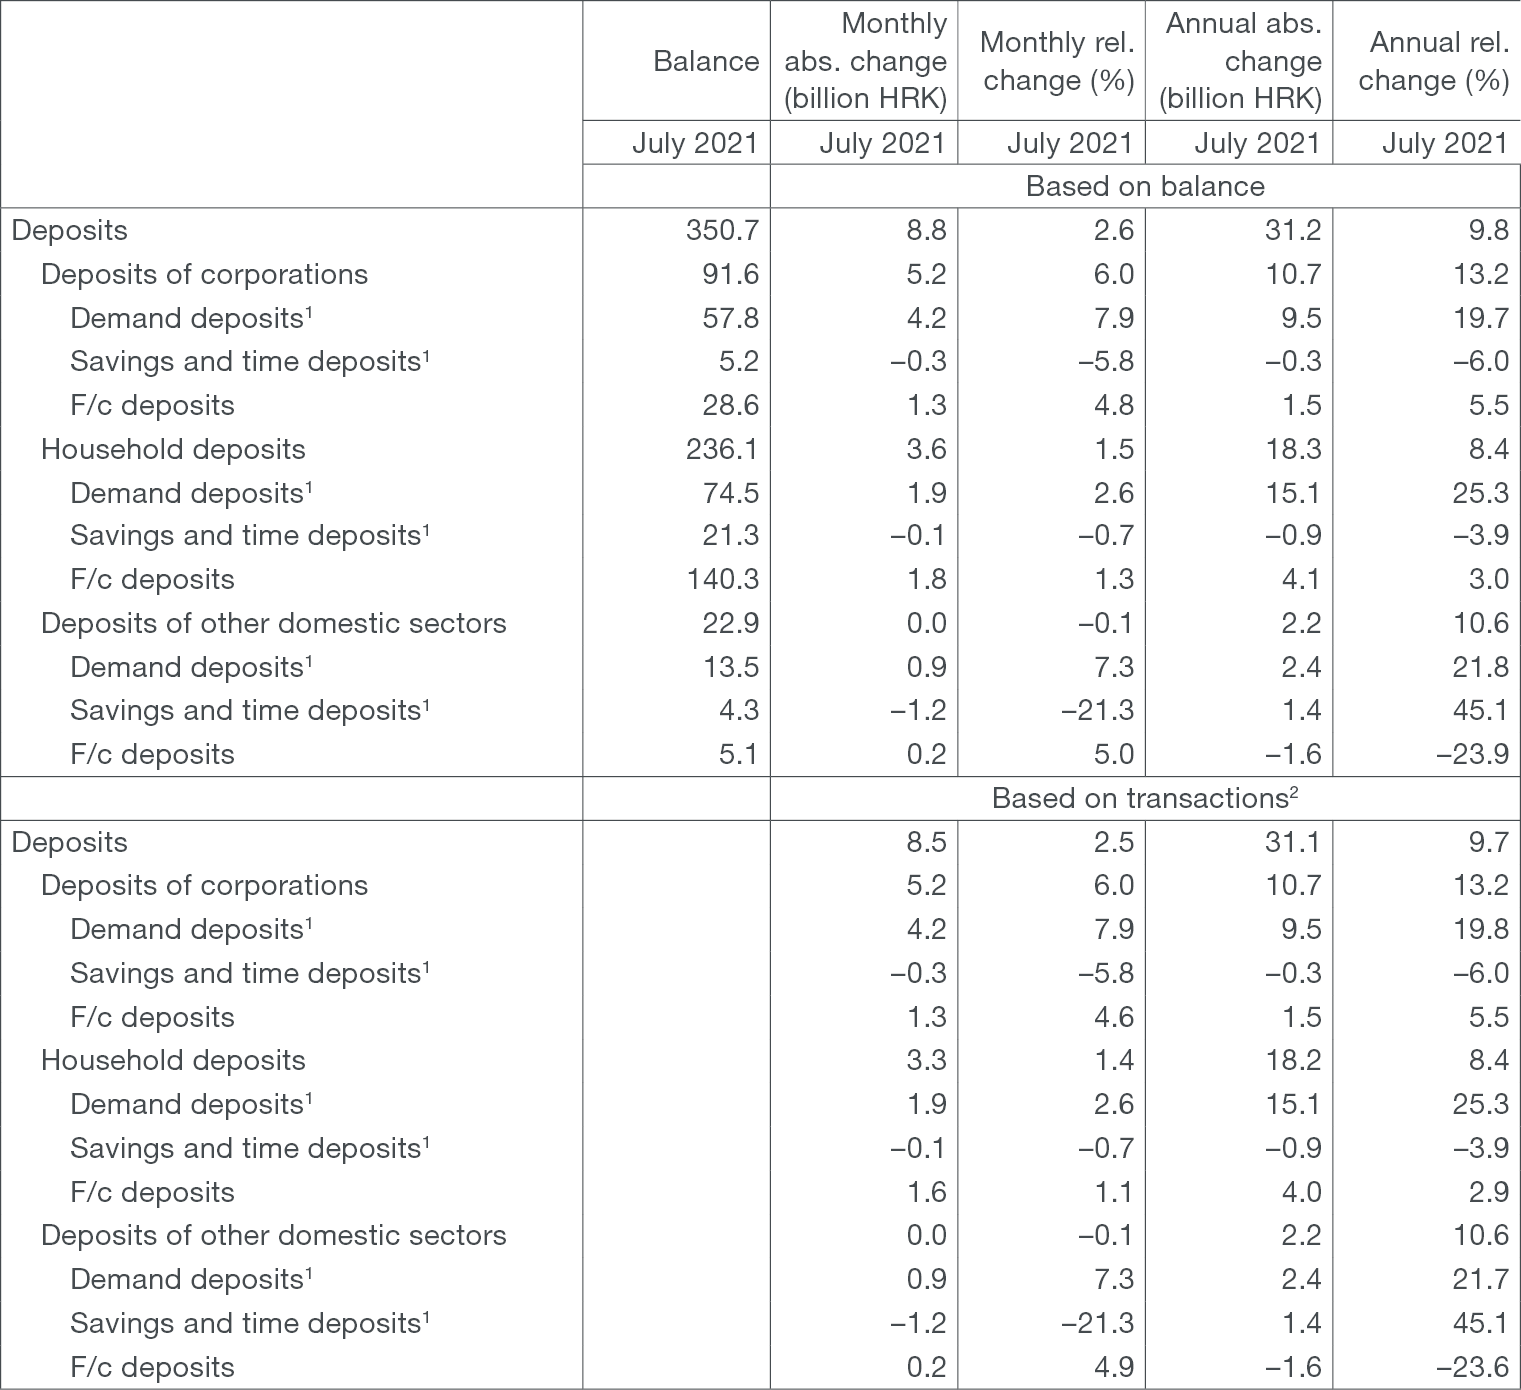
Total liquid assets (M4[1]) rose substantially in July (HRK 10.1bn or 2.6%, transaction-based), largely reflecting a strong growth in net foreign assets (NFA) of credit institutions, spurred by inflows from tourism, while net domestic assets (NDA) fell slightly (Table 1). Money (M1[2]) rose by HRK 8.6bn (4.9%) from the month before, with considerable growth in demand deposits of corporates and a somewhat slower growth in demand deposits of households and currency outside credit institutions. Quasi-money rose by HRK 1.4bn (0.7%), reflecting the growth in household and corporate foreign currency deposits (Table 3). The annual growth in M4 accelerated from 8.7% in June to 9.7% in July, with the annual growth in M1 accelerating from 16.8% to 19.6% (Figure 1), following its slowdown in June, and the annual growth rate of quasi-money slowing down from 2.8% to 2.1% (transaction-based).
| Figure 1 Monetary aggregates annual rates of change based on transactions |
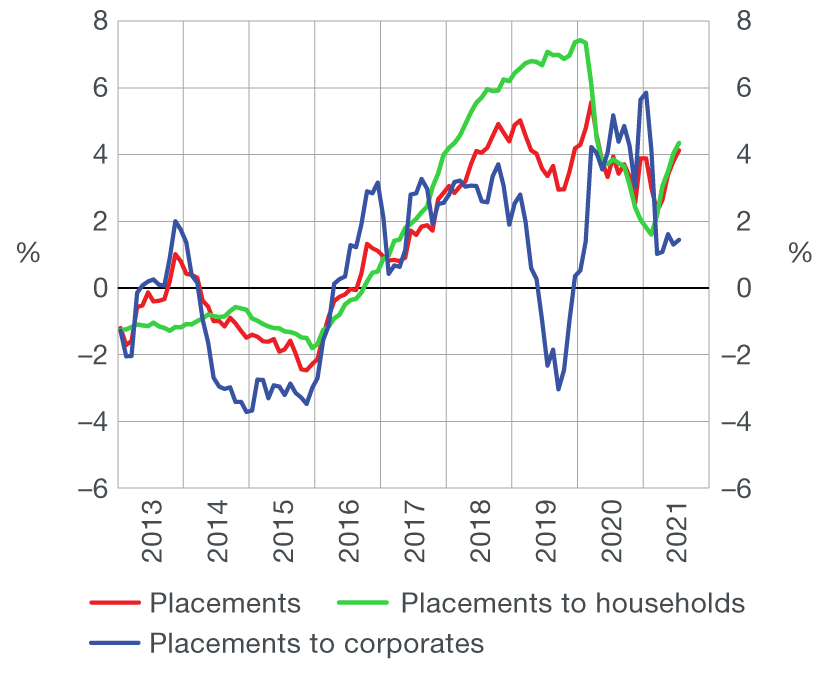
Figure 2 Placements annual rates of change based on transactions |
 |
 |
|
Source: CNB. |
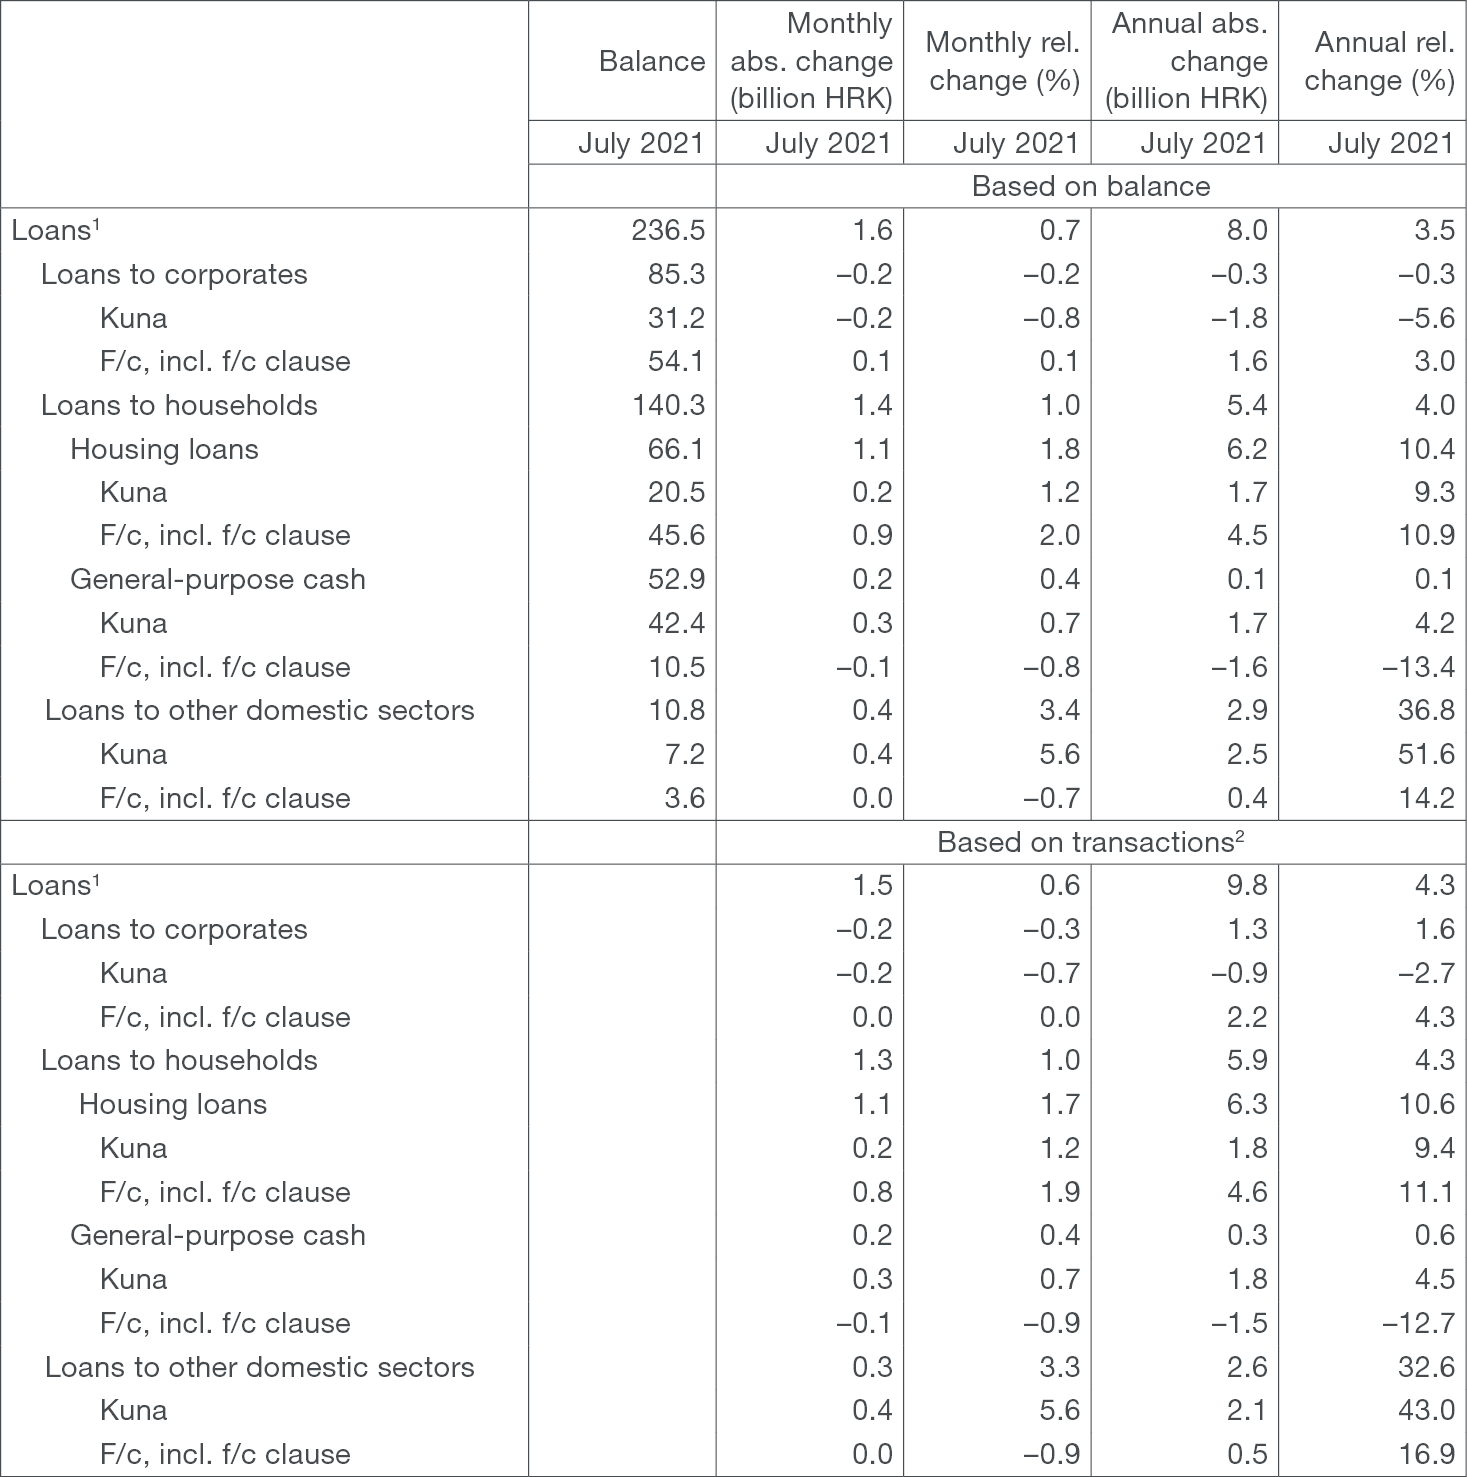
Total placements of monetary institutions to domestic sectors (except the central government) rose in July by HRK 1.5bn or 0.6% (transaction-based) from June and stood at HRK 242.2bn at the end of the month. The annual growth rate of total placements accelerated from 3.8% in June to 4.1% in July (Figure 2). The monthly increase in placements was almost entirely due to the growth in loans which stood at HRK 236.5bn at the end of July (Table 2). Broken down by sectors, household loans rose the most (HRK 1.3bn or 1.0%) driven by the government subsidy programme, which continued to propel a strong growth in housing loans (HRK 1.1bn or 1.7%), while general-purpose cash loans continued to rise moderately (HRK 0.2bn or 0.4%). On an annual level, the growth in housing loans continued to accelerate, having risen from 10.1% to 10.6% and so did the growth in general-purpose cash loans, which rose from 0.2% to 0.6%, resulting in an acceleration in the growth of total loans to households from 4.0% to 4.3%. Loans to other financial institutions rose slightly in July (HRK 0.3bn or 3.3%) while loans to corporates decreased by HRK 0.2bn or 0.3%. Despite the monthly fall, the annual growth rate of loans to corporates accelerated from 1.5% to 1.6% as a result of the base period effect, or a slightly greater fall in lending to corporates in the same month of the previous year.
Table 1 Summary consolidated balance sheet of monetary institutions
in billion HRK and %
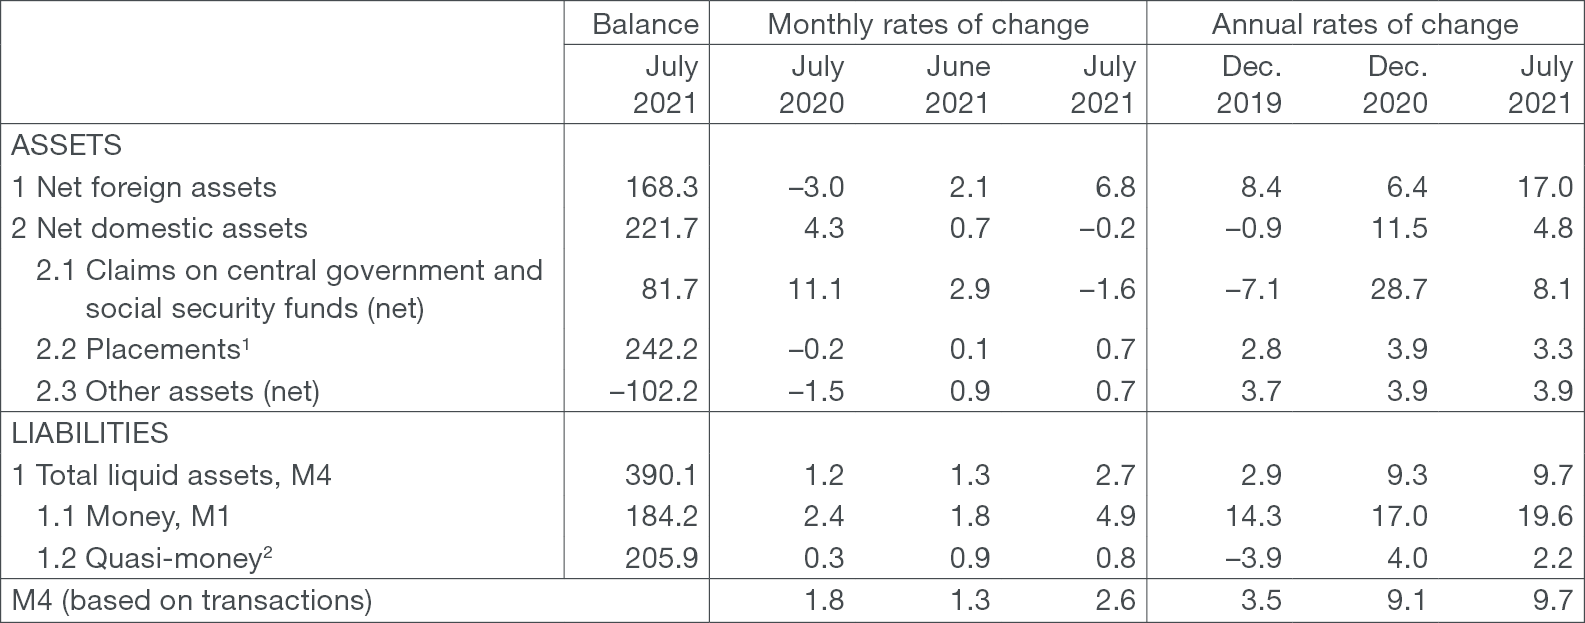
1The sum total of asset items 2.2 to 2.8 of Bulletin Table B1: Consolidated balance sheet of monetary financial institutions.
2The sum total of liability items 2 to 5 of Bulletin Table B1: Consolidated balance sheet of monetary financial institutions.
Source: CNB.
Table 2 Loans (except the central government) and main components
in billion HRK and %
1 In addition to loans to households and corporates, they also include loans to the local government and other financial institutions.
2 The transactions show changes that exclude the effects of exchange rate changes, securities price adjustments, reclassification and write-off of placements, including the sale of placements in the amount of their value adjustment.
Source: CNB.
Table 3 Deposits (except the central government) and main components
in billion HRK and %
1 Includes only kuna sources of funds of credit institutions.
2 The transactions show changes that exclude the effects of exchange rate changes, securities price adjustments, reclassification and write-off of placements, including the sale of placements in the amount of their value adjustment.
Source: CNB.
For detailed information on monetary statistics as at July 2021, see:
Central bank (CNB)
Other monetary financial institutions
