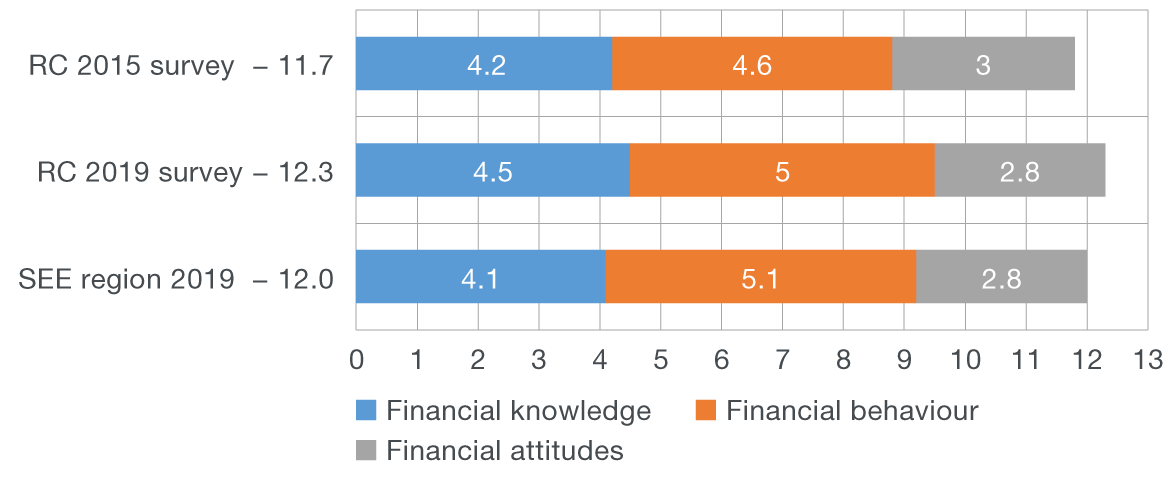
Based on the results of the financial literacy survey conducted in 2015, the score for the Republic of Croatia (RC) was 11.7 points or 56%. According to the survey from 2019, progress was made as the score stood at 12.3 points or 59%. If analysed by components, the score was better in financial knowledge and behaviour and worse in financial attitudes. The Croatian National Bank is the institution which Croatian citizens trust the most with regard to financial literacy.
Although relatively recent, the term “financial literacy” has been increasingly gaining in importance. The most frequently used definition is the one offered by the Organisation for Economic Cooperation and Development (OECD), according to which "financial education is the process by which financial consumers/investors improve their understanding of financial products and concepts and, through information, instruction and/or objective advice, develop the skills and confidence to become more aware of financial risks and opportunities, to make informed choices, to know where to go for help, and to take other effective actions to improve their financial well-being"[1]. Simply said, financial literacy means a set of knowledge and skills needed to understand and manage financial products and services encountered in the market, which belong to the domain of banking, insurance, capital market, etc. With regard to the levels at which we apply our financial knowledge and skills, we distinguish the personal level, the household level, the entrepreneurial venture level or any other level. The above groups of products and the levels of their usage are important for building the framework structure of financial literacy, although it is clear that in daily life no classification into specific boundaries is necessary, but the totality of the decisions adopted determines the improvement or worsening of an individual’s overall economic situation.
What is building and dissemination of financial literacy like in the RC? The National Strategic Framework for Consumer Financial Literacy for the period 2015 – 2020[2] is the fundamental document for this area and the Operational Working Group for monitoring the implementation of measures and activities[3] for financial literacy was established with the Ministry of Finance as coordinator. The survey conducted in 2015 in cooperation with the Croatian Financial Services Supervisory Agency, the Ministry of Finance and the Croatian National Bank served as basis for different educational activities. An upward trend was shown by the new survey conducted in 2019 by the OECD and the Ministry of Finance of the Netherlands. The survey model determined by the OECD/INFE methodology for measuring financial literacy and financial inclusion[4] was used in both surveys.
The results of the repeated survey from 2019 were published in the publication "Financial Literacy of Adults in South East Europe"[5]. The survey was conducted by the OECD in seven countries as part of the Technical Assistance Programme for the Dutch Constituency member countries (OECD/INFE Technical Assistance Project for Financial Education in the Constituency Program of the Netherlands Ministry of Finance). The countries included in the programme in which the survey was conducted are Bulgaria, Croatia, Georgia, North Macedonia, Moldova, Montenegro and Romania. In all, 7422 respondents between the ages of 18 to 79 were surveyed. The survey was conducted in the period from July to September 2019.
Overall level of financial literacy based on the surveys conducted in 2015 and 2019
The overall level of financial literacy in the comparable surveys was considered based on three components: financial knowledge, financial behaviour and financial attitudes. The maximum number of points was 21, of which nine points referred to financial behaviour, seven points to financial knowledge and five points to financial attitudes. Therefore, the total score mostly depends on the score for behaviour with the impact of 43%.
Figure 1 Overall financial literacy – points
Sources: OECD (2020), Financial Literacy of Adults in South East Europe and survey results "Measuring financial literacy and financial inclusion in Croatia", 2015.
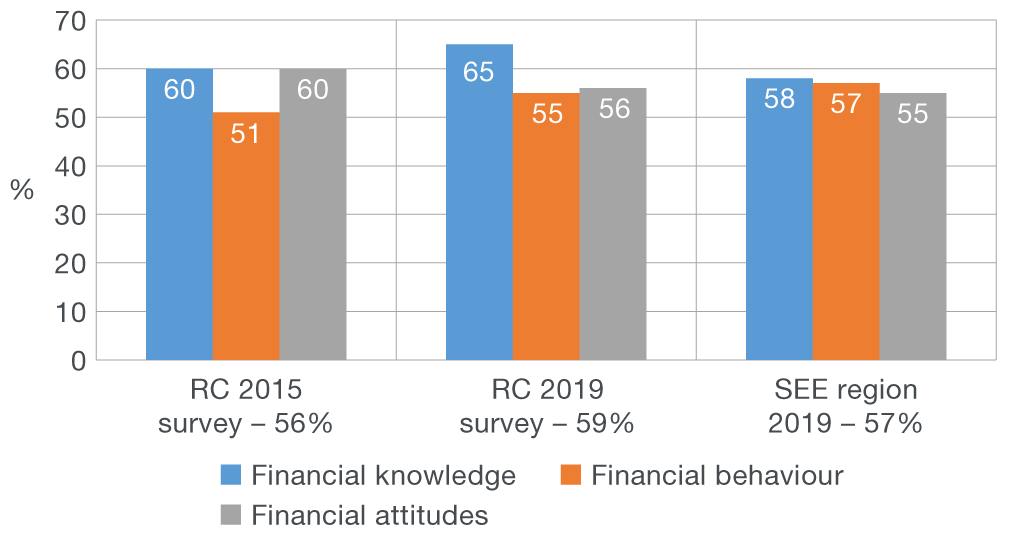
Figure 2 Overall financial literacy – percentage
Sources: OECD (2020), Financial Literacy of Adults in South East Europe and survey results "Measuring financial literacy and financial inclusion in Croatia", 2015.
Based on the results of the survey conducted in 2015, the score for the RC was 11.7 points or 56%, while according to the survey from 2019 progress was made, i.e. the score was 12.3 points or 59%. If analysed by components, the score was better in financial knowledge and behaviour and worse in financial attitude. Below is a detailed analysis of the presented results.
Financial knowledge
The assessment of financial knowledge is based on respondents’ responses to the following seven questions:
- Five brothers are going to be given a gift of 1,000 (local currency unit) and if the brothers have to wait for one year to get their share, and inflation stays at (e.g. 2%), they will be able to buy in one year’s time: less, the same or more than today?
- You lend 25 (local currency unit) in the evening and you are given back 25 (local currency unit) in the morning. How much interest has been paid?
- You put 100 (local currency unit) into a savings account with an interest rate of 2%. How much would be in the account after one year?
- How much would be in the account after 5 years? (more than 110, exactly 110 or less than 110)
- An investment with a high return is likely to be higher risk than an investment with a smaller return. (true/false)
- High inflation means that the cost of living is increasing rapidly. (true/false)
- It is usually possible to reduce the risk of investing by buying a wide range of shares and bonds. (true/false)
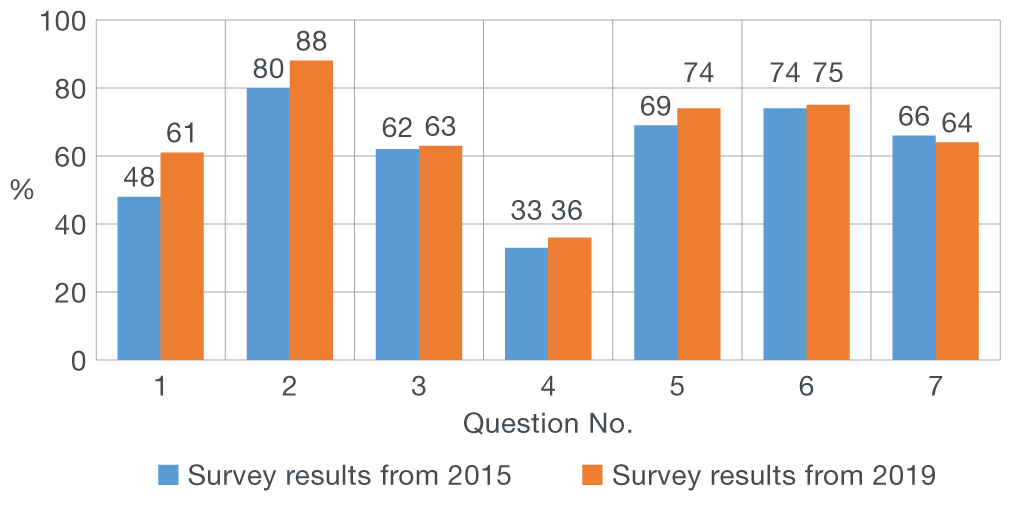
The interdisciplinary character of financial literacy can easily be discerned from the questions based on which the level of financial knowledge was determined. In addition to the factual knowledge of individual financial products and services that can be classified as belonging to some of the groups of school subjects in the field of economy, for example, there are also questions from the field of mathematics (simple and compound interest calculation). The results of the 2019 survey showed that of the seven questions, the smallest percentage of respondents, only 36%, knew the answer to the fourth question on compound interest, while 63% of respondents knew the correct answer to the third question on simple interest calculation. If the two questions are combined, then 24% of respondents answered both questions correctly. The largest number of respondents knew the answer to the second question on interest-free lending.
Figure 3 Financial knowledge – comparison of responses from 2015 and 2019 surveys
Sources: OECD (2020), Financial Literacy of Adults in South East Europe and survey results "Measuring financial literacy and financial inclusion in Croatia", 2015.
If the results of the two conducted surveys are compared, the score was better in six out of seven questions related to financial knowledge. This resulted in an overall better score of 4.5 points (65%) according to the 2019 survey from 4.2 points (60%) scored in 2015. When compared with other countries from the survey conducted in 2019, in addition to Georgia, the RC had the best score, which was even better than the average of the G-20 countries according to the OECD survey from 2017, i.e. 4.3 points (61%)[6].
Financial behaviour
According to the 2019 survey, financial behaviour was analysed through the following topics: Financial control, Financial resilience, Retirement planning and Making informed financial product choices. The questions from the two surveys are largely comparable.
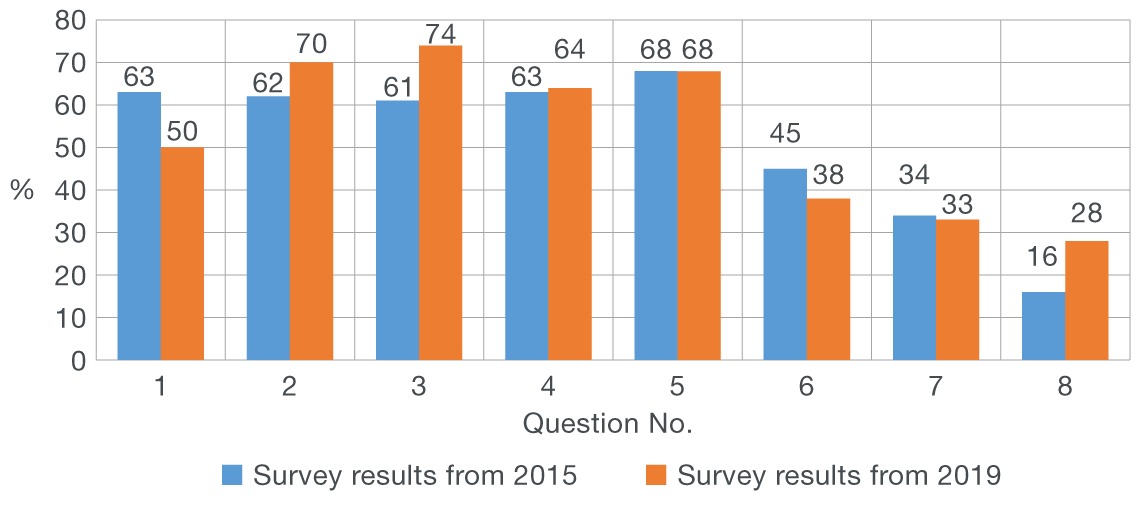
Question (1) “Who is responsible for household money management, is there a personal or a household budget?” showed that only 50% of respondents in Croatia said they had a budget, which was also the lowest score among the comparable countries and considerably below the SEE average of 63%. This question should be compared to the question from the 2015 survey according to which 70% of respondents said they had a budget, while 63% were responsible for finances and had a budget. The importance of understanding planning and budgeting was tested, which in this country was not recognised or was recognised in an insufficient percentage. Points were awarded if a person had a personal or joint responsibility for money management and if a person agreed with the statement in question 4, according to which the person kept watch of financial affairs.
Question (2) tested considered purchase. In response to the question “I think twice before making a purchase”, 70% of respondents in Croatia agree with the statement and think before making a purchase, which is in line with the SEE region average of 71%. This behaviour showed a positive trend, since 62% of respondents agreed with the above statement in the 2015 survey. Avoiding impulse purchases and “weighing” benefits and prices before purchases is considered a desirable financial behaviour and the mentioned results point to raising awareness about the importance of considered purchase in the period between the two surveys conducted.
Question (3) “Paying bills on time” emphasised the importance of preserving a positive credit record and avoiding additional charges. In Croatia, 74% of respondents said they paid their bills on time, which was again a much better score than the score from the 2015 survey, when such a behaviour was recorded in 61% of respondents.
Question (4) “I keep a close watch on my financial affairs” tested the commitment to day-to-day finances and 64% of respondents agreed with the above statement, which was almost the same score as the 63% score from the 2015 survey.
Question (5) “In the past 12 months have you been actively saving money?” is related to the segment of financial resilience. Sixty-eight percent of respondents from Croatia saved actively, which was in line with the average of the SEE countries (67%). In this case, the score was the same as in the 2015 survey, when also 68% of citizens saved actively. The distribution of the forms of savings according to the latest survey is also interesting: 50% savings in cash at home or in the wallet; 38% savings in savings/deposit account; 10% investing into real estate.
Question (6) tested the agreement with the statement “I set long-term financial goals and strive to achieve them”. According to the 2019 survey, 38% of respondents agreed with the statement, or less than the 45% of respondents that agreed with the above statement in the previous survey.
Question (7) is linked to the shortfall in disposable income. Points were awarded to responses that meant that respondents had not experienced a shortfall in income in the last 12 months or had not borrowed to cover the shortfall. The question: “Sometimes people find themselves in a situation where their income does not quite cover their living costs. In the last 12 months, has this happened to you, personally?”, on a sample of respondents from Croatia, showed that such a situation had occurred in 33% of the cases and no significant changes were recorded from the previous survey's score of 34%. The data should definitely be interpreted within the broader economic aspect of a relatively favourable economic situation in the country at the time when the latest survey was conducted. The second part of the question related to the strategies for covering the difference when income failed to meet the living costs, for those who said that their income had not been sufficient in the last 12 months.
Approaches that did not involve borrowing for Croatia: 44% of respondents had cut back on spending, 21% opted to work overtime and earn extra, 10% of respondents would ask friends, family or community for help (the smallest percentage of the countries that participated in the survey), 10% of respondents would draw money out of savings account, while 5% would sell some assets.
The previously mentioned seven behaviours were awarded seven points, while the remaining two points were awarded in accordance with the behaviours related to the selection of financial products. Specifically, this means that it has first been checked whether the customer tried to compare a financial product across different providers of financial products or services. Subsequently, one or two points were awarded, depending on the responses to the questions related to the sources and the manners used in seeking information about products and services.
It is deemed that the comparison of products and seeking independent advice are the characteristics of financially literate consumers. The results for Croatia from the 2019 survey have shown that 33% of respondents would seek independent advice, while 22% of respondents would try to compare products. According to the 2015 survey, 16% of respondents answered that tried, to a certain extent, to make financial decisions based on good quality and independent information from several sources. To facilitate comparison, the average of the scores (28%) of respondents who sought independent advice and tried to compare products was used, and the data was compared to the score of 16% of respondents who tried to make a decision on a financial product based on independent and good quality information from several sources (Question 8).
With regard to seeking advice, the 2019 survey additionally enquired about what sources of financial education were trusted by respondents. The results for Croatia (multiple responses possible): central bank 32% (CEE region average 34%), government ministry 18%, consumer protection agency 15%, non-profit education agency/NGO 3%, private bank 4%, none 18%, don’t know 9%.
Figure 4 Which institution would you trust to receive financial education from?
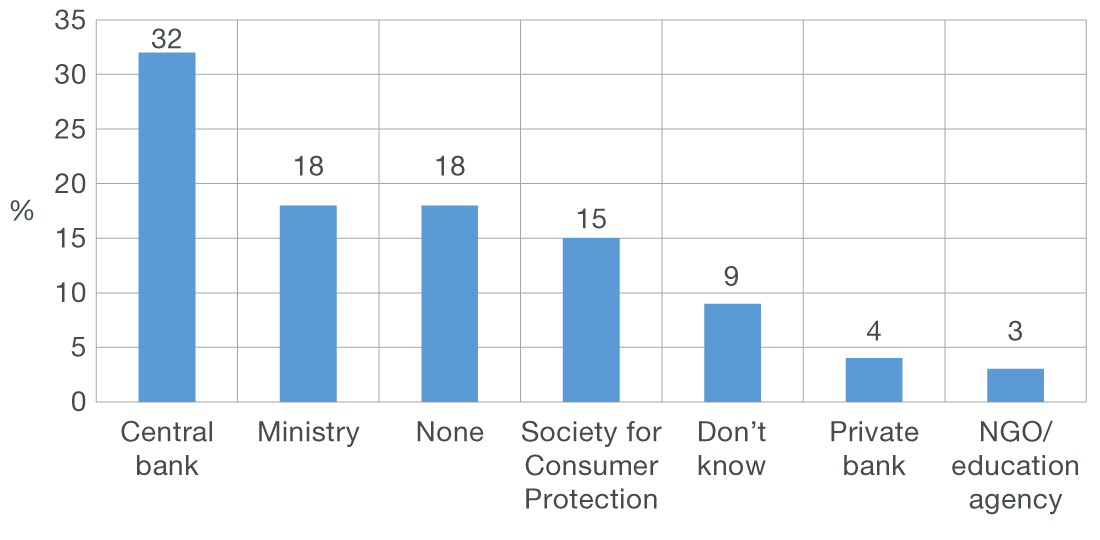
Source: OECD (2020), Financial Literacy of Adults in South East Europe.
A better score was achieved in the three questions related to financial behaviour, i.e. there had been improvement, while a much lower score was recorded in the question related to the existence of a budget and setting long-term financial goals. The results lead to the conclusion that a half of the respondents in Croatia did not recognised the setting up of a personal or household budget as a useful tool.
The overall score on financial behaviour for Croatia is 5.0 points or 55%, which is a worse score than the average for the SEE region of 5.1 or 57%. Despite the above, the score was better than in the 2015 survey, when 4.6 points or 51% was scored on financial behaviour.
Figure 5 Financial behaviour – comparison of answers by questions from 2015 and 2019 surveys
Sources: OECD (2020), Financial Literacy of Adults in South East Europe and survey results "Measuring financial literacy and financial inclusion in Croatia", 2015.
Financial attitudes
According to the earlier survey from 2015 and the new survey from 2019, financial attitudes are analysed based on gauging respondents’ attitudes according to the three given statements:
- I find it more satisfying to spend money than to save it for the long term.
- I tend to live for today and let tomorrow take care of itself.
- Money is there to be spent.
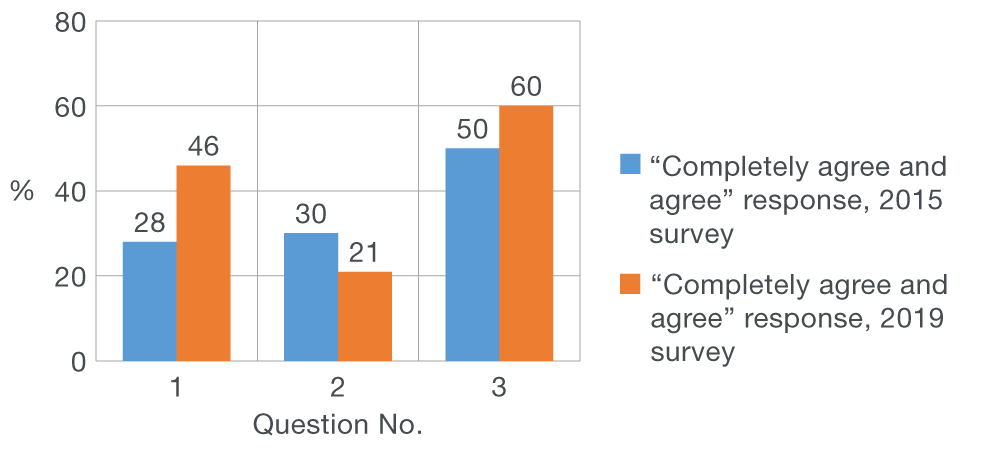
Figure 6 Financial attitudes – responses "completely agree and agree" by questions from 2015 and 2019 surveys
Sources: OECD (2020), Financial Literacy of Adults in South East Europe and survey results "Measuring financial literacy and financial inclusion in Croatia", 2015.
More respondents now agree with the statement on more satisfying to spend money than to save it, and money is there to be spent than in the 2015 survey, with a more noticeable growth in the case of the former statement of 18%. However, the survey uses the above statements to gauge respondents’ attitudes, with which behaviour does not necessarily have to be correlated. A smaller percentage of respondents agree with the attitude live for today and let tomorrow take care of itself, when compared with the 2015 survey.
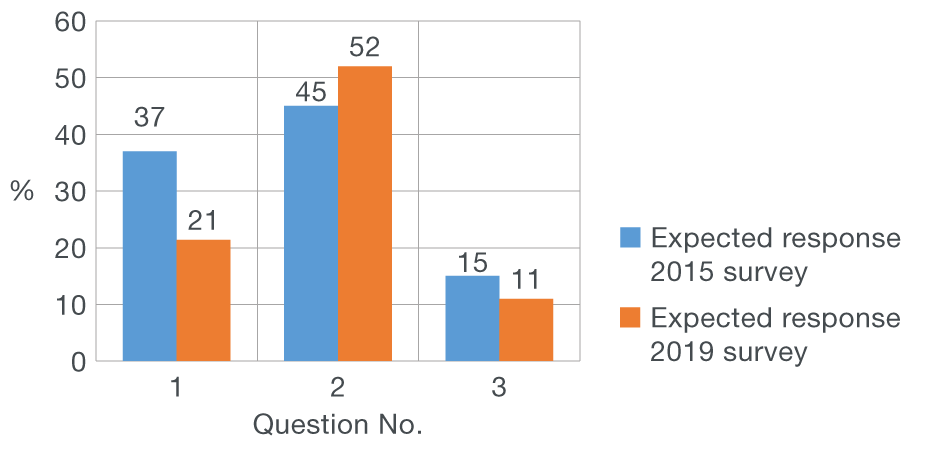
If the same data are reversed (indecisive excluded) and if the distribution of expected responses is analysed, very concerning and low percentages of expected responses can be found, related to the attitudes that are considered a precondition for a high level of financial literacy. This is particularly pronounced in the case of the third attitude, according to which only 11% of respondents do not agree or completely do not agree with the statement that money is here to be spent.
Figure 7 Financial attitudes – comparison of expected responses from 2015 and 2019 surveys
Sources: OECD (2020), Financial Literacy of Adults in South East Europe and survey results "Measuring financial literacy and financial inclusion in Croatia", 2015.
The overall score for the component of financial attitudes for respondents from the RC is 2.8 or 56%, the same score as the average of the SEE region. However, with regard to financial attitudes, a negative trend was also recorded relative to the 2015 survey, when the score of 3 points or 60% was achieved.
Overall, a better result in the area of knowledge is satisfactory, in particular if we have in mind that no external factor (e.g. favourable economic situation) can have any impact on it, such as in the case of financial attitudes. However, a relatively good result and high self-confidence (80% of respondents assessed their knowledge as average or high), should be taken with caution, in particular taking into account that only 24% of respondents knew both responses regarding interest calculation. In other words, the positive trend is encouraging, but we must be aware that it will not continue unless additional efforts are invested. Progress has been made in the financial behaviour segment, as well as in lagging behind the region’s average, while financial attitudes are a component to which most attention should be paid, while striving to direct the general tendency towards spending and short-term goals more towards savings and achieving long-term plans. It will eventually contribute to good quality financial decisions that are one of the preconditions for a better quality of life and a higher standard for individuals.
In conclusion, although progress has been made in the important components of financial literacy, there is still significant room for improvement. It can only be achieved through a joint action of individuals who, with their attitudes and eagerness to learn, open the space for improvement of their knowledge and skills, together with an extensive effort invested by the key educational and regulatory institutions, as well as a positive contribution of financial market actors.
- OECD, 2005, Improving Financial Literacy: Analysis of Issues and Policies, Paris: OECD, str. 13 ↑
- Official Gazette 11/2015↑
- https://mfin.gov.hr/istaknute-teme/financijski-sustav/financijska-pismenost-potrosaca/425 (only in Croatian). ↑
- OECD (2018), OECD/INFE Toolkit for Measuring Financial Literacy and Financial Inclusion ↑
- OECD (2020.), Financial Literacy of Adults in South East Europe ↑
- OECD (2017.), G20/OECD INFE report on adult financial literacy in G20 countries ↑
