Statistical releases provide a summary of the most recent values and trends for the published statistical indicators series compiled by the Croatian National Bank.
Statistics
- Release calendar
- Statistical releases
- Indicators of banking system operations
- Main macroeconomic indicators
-
Statistical data
-
Financial sector
- Republic of Croatia contribution to euro area monetary aggregates
- Consolidated balance sheet of MFIs
- Central bank (CNB)
- Other monetary financial institutions
- Other financial corporations
- General government sector
- External sector
- Financial accounts
- Securities
- Selected non-financial statistics
- Payment systems
- Payment services
- Currency
- Turnover of authorised exchange offices
- Archive
-
Financial sector
- SDDS
- Regulations
- Information for reporting entities
- Information for users of statistical data
- Use of confidential statistical data of the CNB for scientific purposes
- Statistical surveys
- Experimental statistics
Statistical releases
Release of statistical data on the balance of payments, gross external debt position and international investment position for the third quarter of 2023
Release of statistical data on the balance of payments, gross external debt position and international investment position for the third quarter of 2023
Summary
- In the third quarter of 2023, the current and capital account balance amounted to EUR 5.78bn, which is a noticeable increase from EUR 4.37bn recorded in the same quarter of the preceding year
- A positive balance of EUR 3.47bn (net capital outflow) was recorded in the financial account of the balance of payments in the third quarter of 2023, while in the same quarter in 2022, a net capital outflow of EUR 2.15bn was recorded
- The net international investment position stood at EUR –15.82bn or –21.3% of GDP at the end of the third quarter
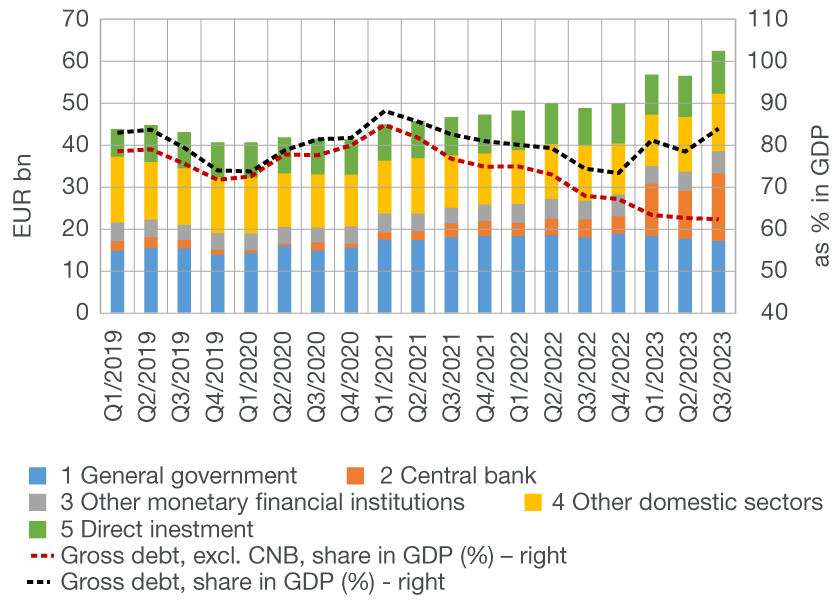
- The gross external debt position stood at EUR 62.44bn or 83.9% of GDP at the end of the third quarter
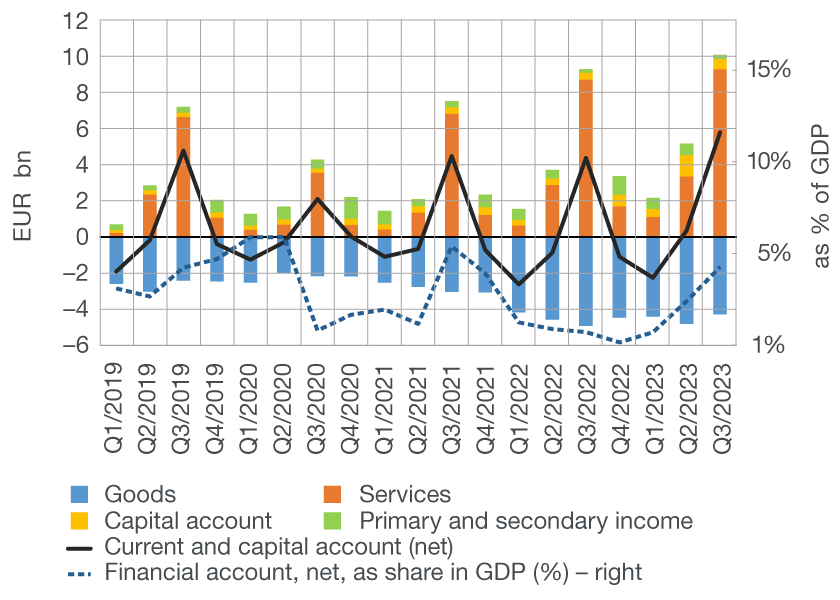
The current and capital account of the balance of payments (Figure 1) ran a surplus of EUR 5.78bn in the third quarter of 2023, which is an increase of EUR 1.41bn over the same period of the preceding year. This was primarily due to revenues from travel of EUR 9.12bn, (which, in the third quarter of 2022, totalled EUR 8.47bn), that mainly affected an increase of EUR 0.57bn in the positive balance on the services sub-account. The negative balance on the goods sub-account improved by EUR 0.63bn from the same quarter in 2022, although the values of both exports and imports of goods declined (having gone down by 19.8% and 16.6%, respectively). The balances in the primary and secondary income accounts[1] saw no significant changes, while the positive balance in capital transactions improved by EUR 0.17bn from the same quarter of the previous year mainly owing to increased payments from EU funds to end beneficiaries.
Figure 1 Balance of payments, current and capital account
1 Sum of the last four quarters
Source: CNB.
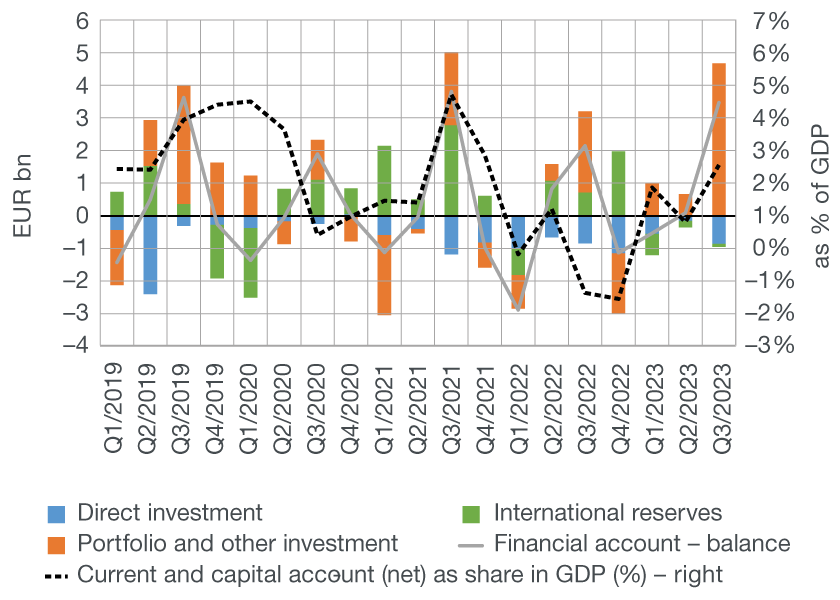
Net capital outflow (positive difference between total assets acquired and total liabilities incurred) in the financial account (Figure 2) totalled EUR 3.47bn in the third quarter of 2023, having gone up by EUR 1.32bn from the same period in 2022. Net capital outflow recorded was, to a larger extent, a result of a significant net outflow on the other investment account. At the same time, a slight decrease was seen in international reserves, which, after Croatia’s entry into the euro area, mainly refer to the dollar portfolio managed by the Croatian National Bank. Finally, the net inflow on the direct investment sub-account hovered around EUR 0.86bn, an amount similar to that recorded in the same quarter in 2022, while the account of portfolio investment recorded a net capital outflow of EUR 0.37bn.
Figure 2 Balance of payments, financial account
1 Sum of the last four quarters
Source: CNB.
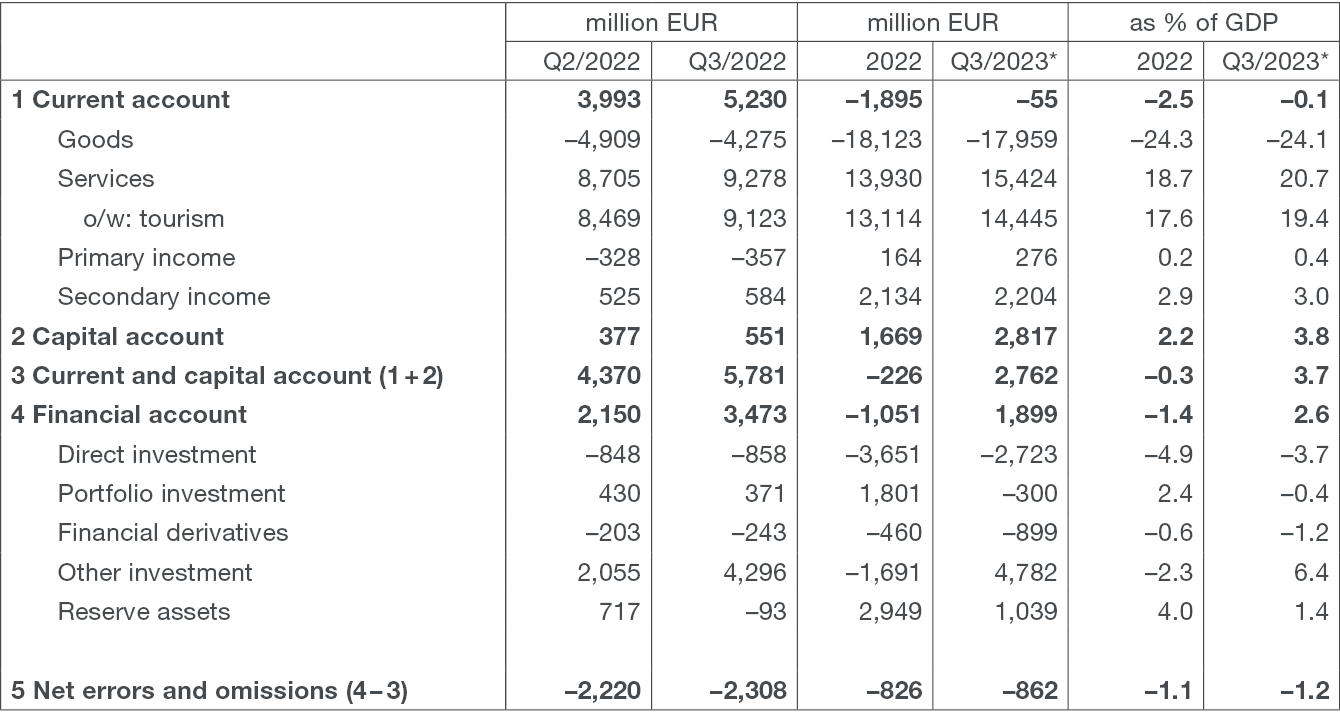
If the last four quarters are observed (Table 1), the cumulative surplus in the current and capital account in the period up to the end of September 2023 totalled EUR 2.76bn or 3.7% of GDP, while in 2022 as a whole it amounted to EUR –226m or –0.3% of GDP. In the same four quarters period, a net outflow of EUR 1.90bn or 2.6% of GDP was recorded in the financial account, relative to the net inflow of EUR 1.05bn or –1.4% of GDP recorded in 2022 as a whole.
Table 1 Balance of payments
* Sum of the last four quarters
Note: Positive net values for individual financial account components in Table 1 and Figure 2 indicate that transactions by which foreign assets are acquired are larger than the transactions by which foreign liabilities are incurred for a given financial account component over a given period or denote net capital outflow abroad. Negative values indicate that the transactions by which foreign assets are acquired are smaller than the transactions by which foreign liabilities are incurred for a given financial account component over a given period or denote net capital inflow from abroad.
Source: CNB.
At the end of September 2023, the net international investment position (Figure 3) stood at EUR –15.82bn, which implies a decrease of EUR 3.55bn in negative balance from the end of June 2023. The relative indicator of the net international investment position improved from –26.9% of GDP at the end of June 2023 to –21.3% of GDP.
Figure 3 International investment position
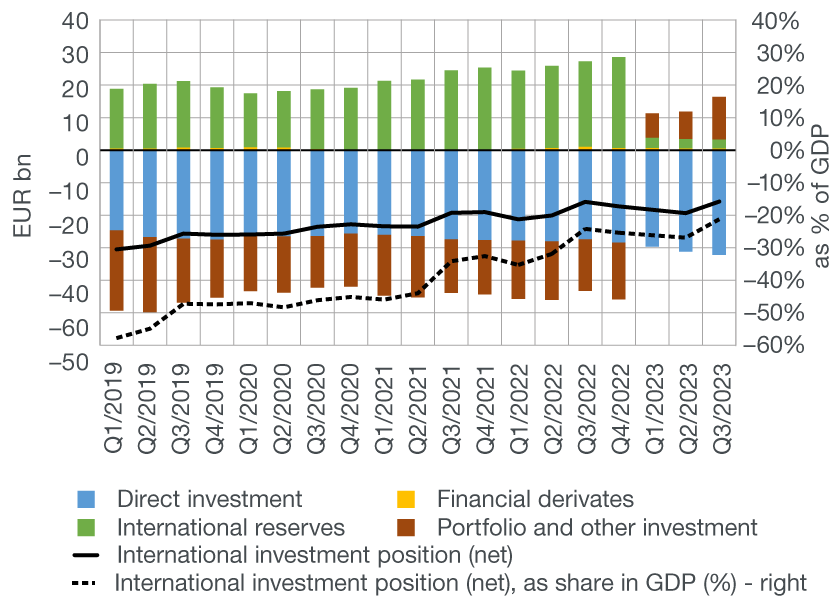
Note: The international investment position equals the difference between domestic sectors' foreign assets and liabilities at the end of a period. The negative value of the net international investment position indicates that foreign liabilities of Croatian residents are greater than their foreign assets. Included are assets and liabilities based on debt instruments, equity investments, financial derivatives, and other instruments.
Source: CNB.
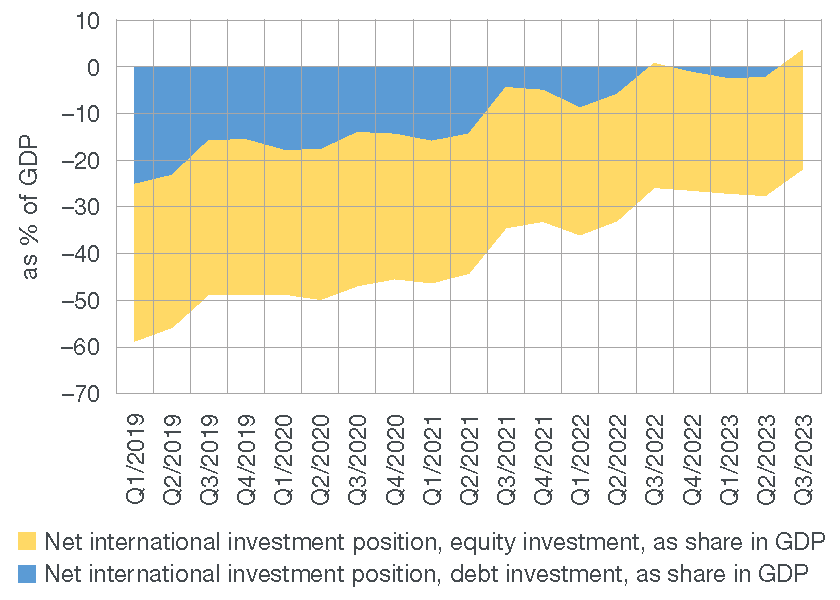
• Considering the share of the net international investment position in GDP according to investment type (Figure 4), the share in GDP improved further, with the share of net debt investment in GDP improving from –2.3% in June to 3.5% in September and the share of net equity investment worsening slightly from –25.3% to –25.4%.
Figure 4 Share of international investment position in GDP by type of investment
The gross external debt position (Figure 5) stood at EUR 62.44bn or 83.9% of GDP at the end of September 2023, having gone up by EUR 5.95bn or 5.5 percentage points in GDP from the end of June 2023. Gross external debt excluding CNB increased by EUR 1.3bn from June, or decreased by 0.3 percentage points if the share of debt in GDP is observed. The influence of other domestic sectors on the growth in gross external debt was relatively minor.
Figure 5 Stock of gross external debt
Detailed balance of payments data
Detailed outstanding gross external debt data
Detailed data on the international investment position
-
Primary income consists of the compensations of employees and investment income (reinvested earnings, dividends, interest). Secondary income refers to current transfers (workers’ remittances, pensions, gifts and grants, taxes and contributions, international cooperation) ↑
