Monitoring GDP during the pandemic (Lucija Fioretti, Karlo Kotarac, Davor Kunovac)
The traditional monitoring of “current economic activity”, in the sense of estimating the GDP dynamics in the current (or previous) quarter, has proved to be particularly challenging during the COVID-19 pandemic. Standard monthly indicators, such as industrial production and retail trade, which help in estimating yet unreleased rates of change in GDP, mostly lost their otherwise solid predictive features in 2020. In addition, due to frequent changes in the epidemiological situation and the stringency of measures imposed in Croatia and abroad during the pandemic, economic activity was subject to strong and frequent “breaks”. For this reason, the estimates of current economic activity had to be updated more frequently than with the usual monthly or quarterly dynamics. The new Weekly Economic Activity (WEA) indicator was thus constructed at the Croatian National Bank, based on the dynamics of a series of very frequent data. The WEA indicator has proved to be useful in monitoring changes in real activity on a weekly basis as well as in the context of the need for a more frequent estimate of the current rate of change in GDP.
What is nowcasting and why do we need new models for monitoring economic activity?
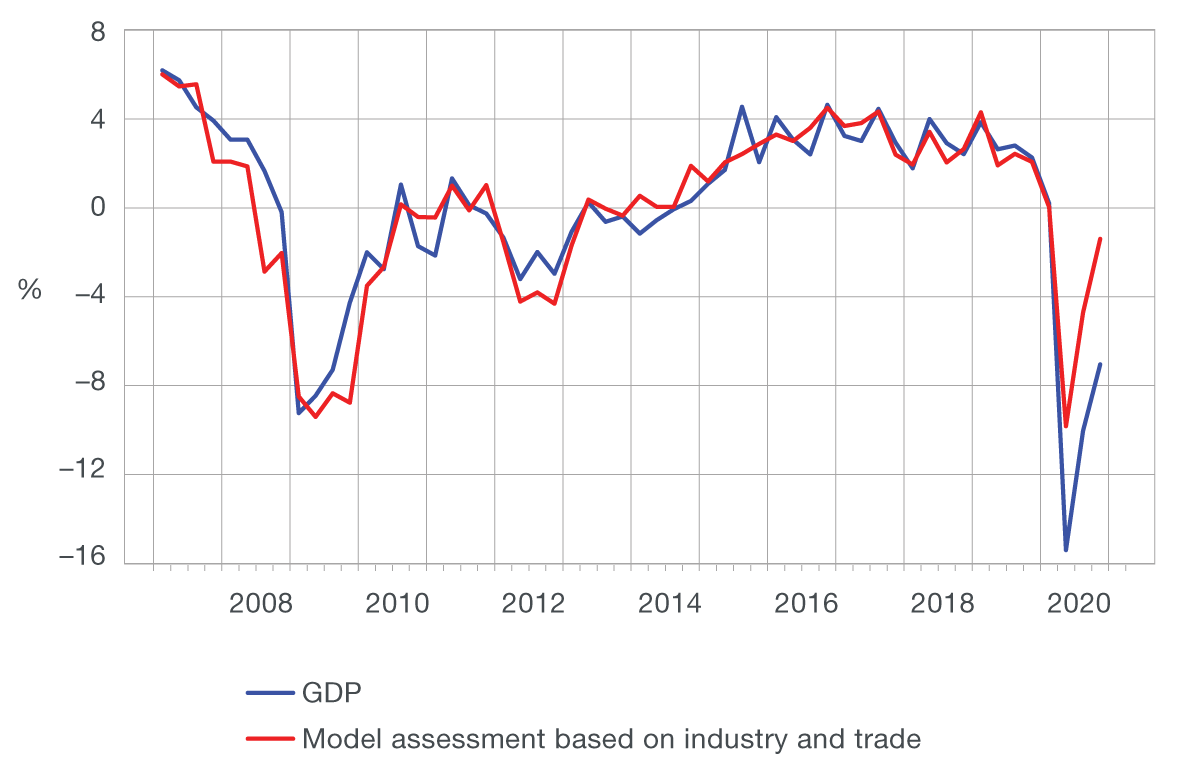
Figure 1 Year-on-year GDP growth rate and its estimate based on the relation between GDP and industrial production and retail trade

The quarterly GDP data are usually available with a relatively large time lag, which hampers the assessment of the current state of the economy and the development of long-term projections. The Croatian Bureau of Statistics releases the first GDP estimate two months after the end of the quarter, which is one of the largest lags among the EU member states. For this reason, economists develop models for nowcasting GDP based on the available monthly indicators, such as industrial production and retail trade. Figure 1 thus illustrates that the annual real GDP growth rate could be well approximated using the dynamics of the available indicators before the onset of the pandemic. However, in the last three quarters the predictive capacity of these indicators in estimating GDP has been weakening and they alone could not capture the depth of the current recession. One of the key reasons for the weaker correlation between GDP and the standard monthly indicators is found in the asymmetric impact of the pandemic on a part of service activities relative to some other activities, such as manufacturing, trade or construction. Thus, for example, retail trade used to be a good indicator of the dynamics of personal consumption and therefore of GDP. However, the trade turnover during the pandemic recovered relatively quickly after the initial sharp decline, in contrast to other consumption components, primarily associated with the accommodation and catering services, which are still considerably below the pre-pandemic level.
Apart from the loss of correlation between the standard monthly indicators and quarterly GDP, the existing nowcasting models also revealed an additional shortcoming during the pandemic. Due to frequent changes in the epidemiological situation and the stringency of the measures imposed, the estimates of current real activity had to be updated more frequently relative to the usual monthly or quarterly dynamics. The previous week’s estimates of economic developments often ceased to be relevant as the epidemiological situation changed and there was need for a new evaluation of economic activity on a weekly basis. As a result of all of the above, it was necessary to develop new models for monitoring real activity, based on variables that were available at a higher frequency and could describe economic activity developments.
Available high-frequency indicators of real activity for Croatia
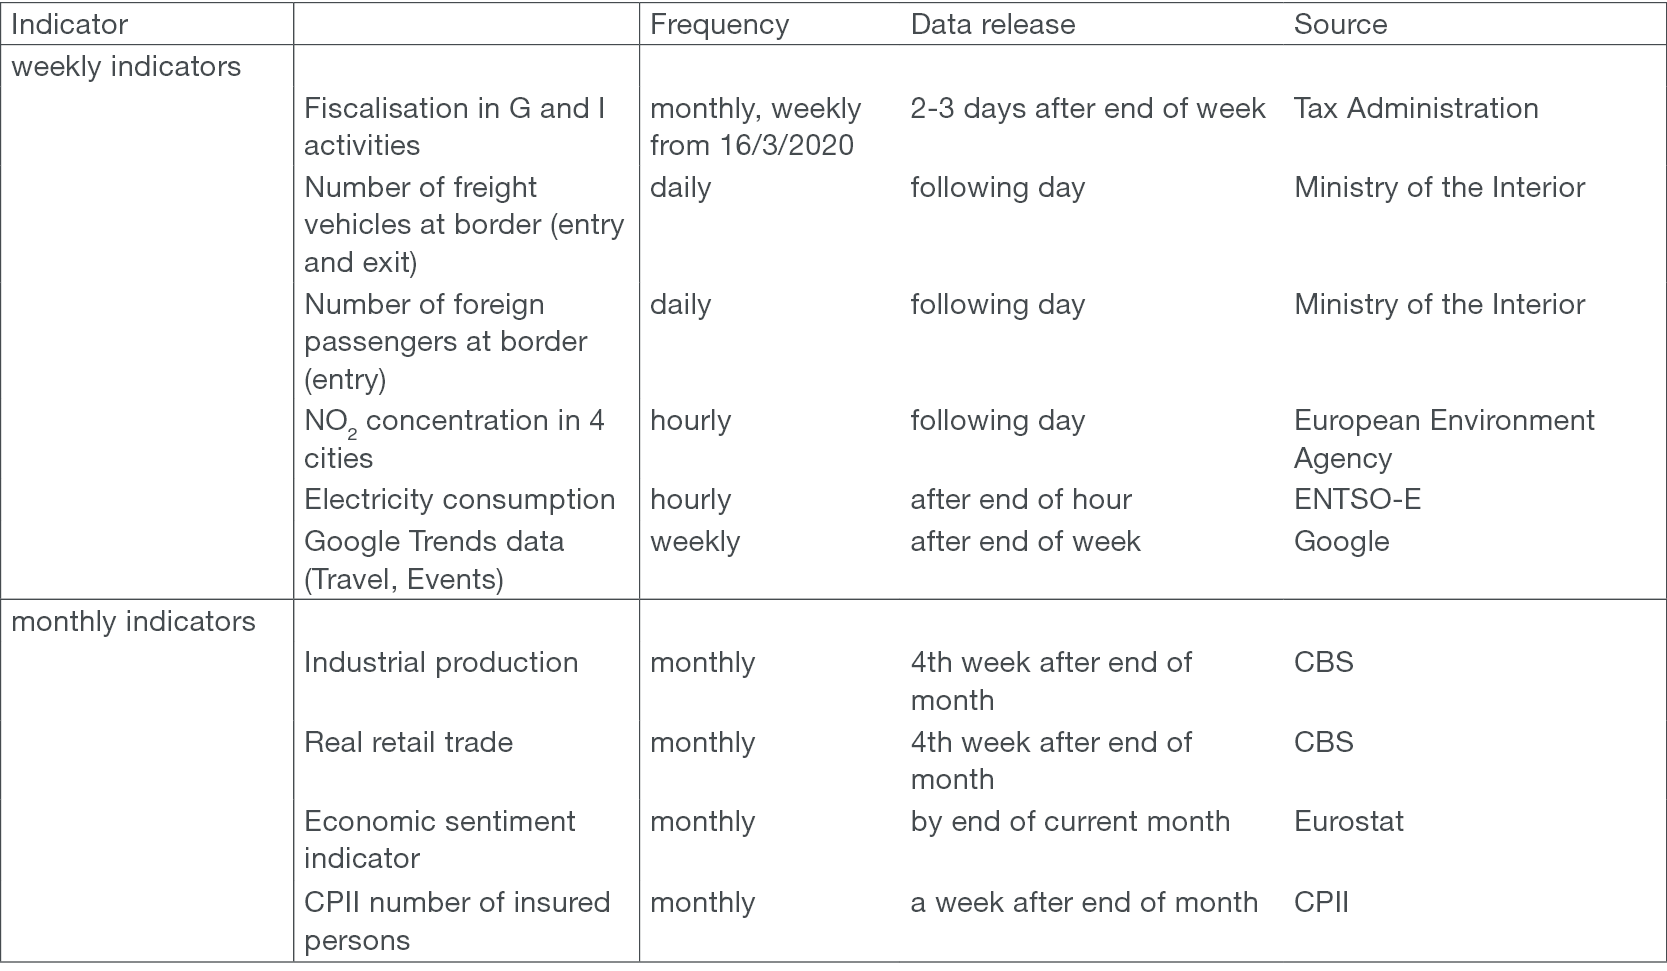
We constructed the composite Weekly Economic Activity (WEA) indicator based on the dynamics of eight weekly and four monthly indicators presented in Table 1. The most important criterion for the selection of weekly indicators was their correlation with the quarterly GDP dynamics, in particular during the pandemic. The Tax Administration data on fiscalisation, the data on certain keyword searches on Google, the consumption of electricity, the air pollution with Nitrogen Dioxide (NO2) and the data of the Ministry of the Interior on cross-border traffic proved to be the most useful data among the set of tested data series.
Table 1 Indicators used for the construction of the composite WEA indicator

Soon after the outbreak of the pandemic, the Tax Administration started with weekly reporting on the number and the value of receipts in the fiscalisation system that describe the movements of value-added tax (VAT) revenues, and at the same time provide a quick insight into the effects of the epidemiological measures on consumption. In addition to the aggregate data on fiscalised receipts in all activities, indicators for the activities severely hit by the pandemic, i.e. trade, catering and accommodation service activities, were particularly important. The inclusion of these data in the WEA indicator provides the answer to the mentioned problems of the loss of correlation between GDP and the traditional indicators, such as retail trade, during the pandemic. Furthermore, the publicly available data on Google searches can help in assessing economic activity. The popularity of certain specific queries or any of the thousand predefined categories[1], which combine a large number of related queries, may be correlated with labour market trends and activities such as travel or going to cinemas and restaurants. In general, it can be a good indicator of the economic effects of the epidemiological measures.[2] The analysis suggests that “travel” and “events (clubs and night life, cinemas, theatres, sporting events...)” are the most useful categories for monitoring GDP developments at a weekly level. The electricity consumption is a good indicator of the intensity of total economic activity at a very high frequency and a solid signal of a strong and sudden change in the usual functioning of the economy. The Nitrogen Dioxide concentration in the air is associated with the burning of fossil fuels, which makes it a good high-frequency indicator of the intensity of traffic and industry. Finally, the Ministry of the Interior data on cross-border traffic provide information on foreign tourist arrivals, that is, the number of foreigners entering Croatia, as well as the number of freight vehicles at border crossings which is associated with traffic and the exchange of goods.
The selected weekly indicators proved to be successful in detecting strong and frequent changes in real activity, such as those recorded in 2020. However, relying exclusively on indicators that reacted very strongly during the pandemic may result in a certain “downward” bias of the weekly indicator of real activity. Therefore, in its construction, it is also important to take into account certain standard monthly indicators that were well correlated with GDP growth in the previous periods. In addition to the previously mentioned industrial production and retail trade, the monthly data on the number of insured persons with the Croatian Pension Insurance Institute (CPII) and the Economic Sentiment Indicator for Croatia were also used because of their early availability and the high correlation with GDP.
Weekly Economic Activity (WEA) indicator for Croatia
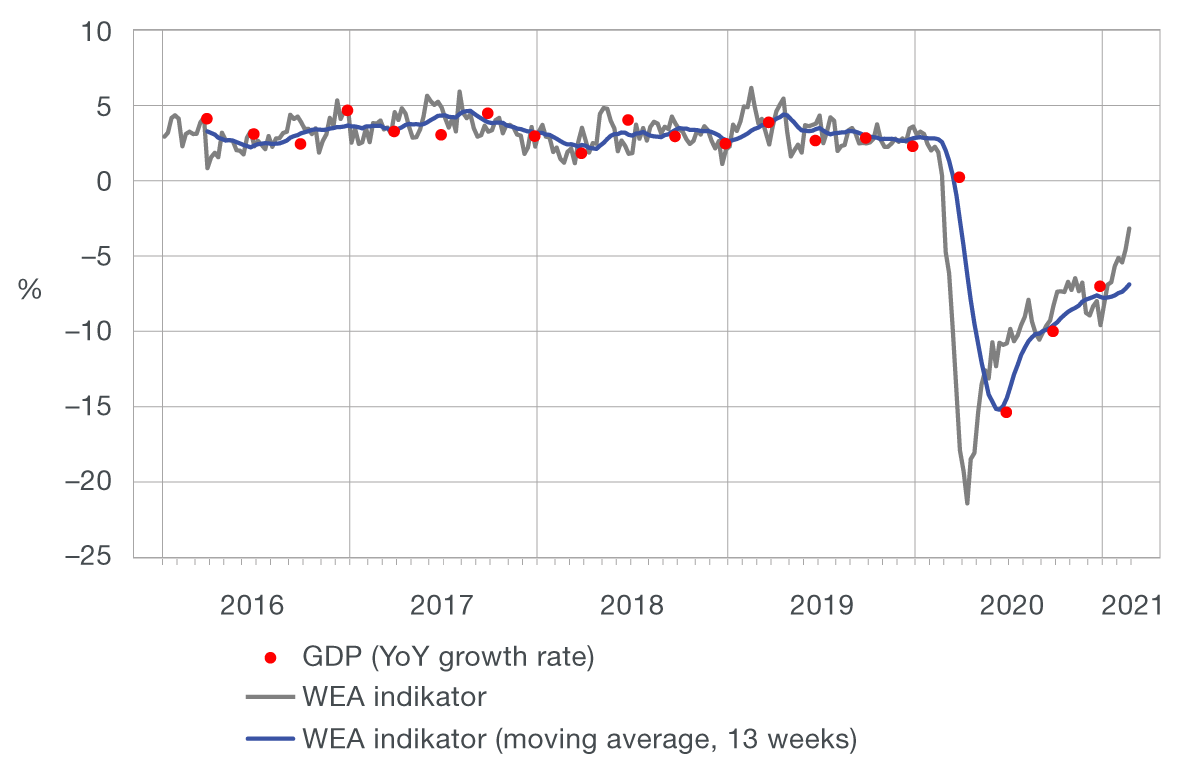
Figure 2 WEA indicator and GDP outturns

We constructed the Weekly Economic Activity (WEA) indicator in two steps. In the first step, using the Principal Components Analysis (PCA), we summarised the common dynamics of all series from Table 1 in the form of a single indicator at a weekly frequency.[3] In the second step, we constructed the WEA indicator on the basis of a simple linear relationship between quarterly GDP and the weekly indicator constructed based on the data from Table 1.
Figure 2 compares the annual quarterly GDP growth rate (red) with the WEA indicator at a weekly (grey) and quarterly (blue) frequency, which was constructed using the 13-week moving averages. The moving averages at the end of each quarter track very closely the realised rates of change in GDP in that quarter, which indicates the reliability of the WEA indicator in monitoring the dynamics of real activity at a weekly level, in particular its strong and sudden changes during the pandemic. The WEA indicator thus showed that economic activity had reached bottom as early as in mid-April, almost immediately after the outbreak of the pandemic and the imposing of epidemiological measures, when the highest estimated rate of decline exceeded 20 percent at a weekly level. This was followed by the recovery in economic activity, which was very rapid at first, so that by the end of the second quarter economic activity already made up for a half of the initial loss. The slowdown in the pace of recovery in the third and the fourth quarter held economic activity by the end of 2020 at the level approximately 7% lower than in the same period of 2019. The new weekly indicator suggests that economic activity is gradually recovering towards the end of February and that similar trends will continue in 2021. As soon as data for March become available, we expect that this recovery will accelerate due to the easing of restrictions with regard to certain service activities, while the annual growth rate will also be pushed forward by the base effect associated with the start of the pandemic and the decline in all relevant indicators in March 2020. All of this supports the expectations of more favourable developments in economic activity at an annual level in March, which might eventually result in a smaller fall in GDP in the first quarter of the current year from the decline recorded in the last quarter of 2020.
-
https://github.com/pat310/google-trends-api/wiki/Google-Trends-Categories ↑
-
See, for example, Woloszko, N. (2020): Tracking activity in real time with Google Trends. ↑
-
The construction of this indicator is based on the simultaneous application of monthly and weekly data and thus associated with certain technical challenges because the monthly data are available several weeks later relative to the weekly data. The problem of missing data was resolved using an iterative EM (expectation maximisation) algorithm. ↑

